SmartRelay UI
The UI for analyzing the reporting of emails sent via the SmartRelay SMTP service is available at this url.
You can access it using the same credentials (username and password) as the other platform modules.
Dashboard
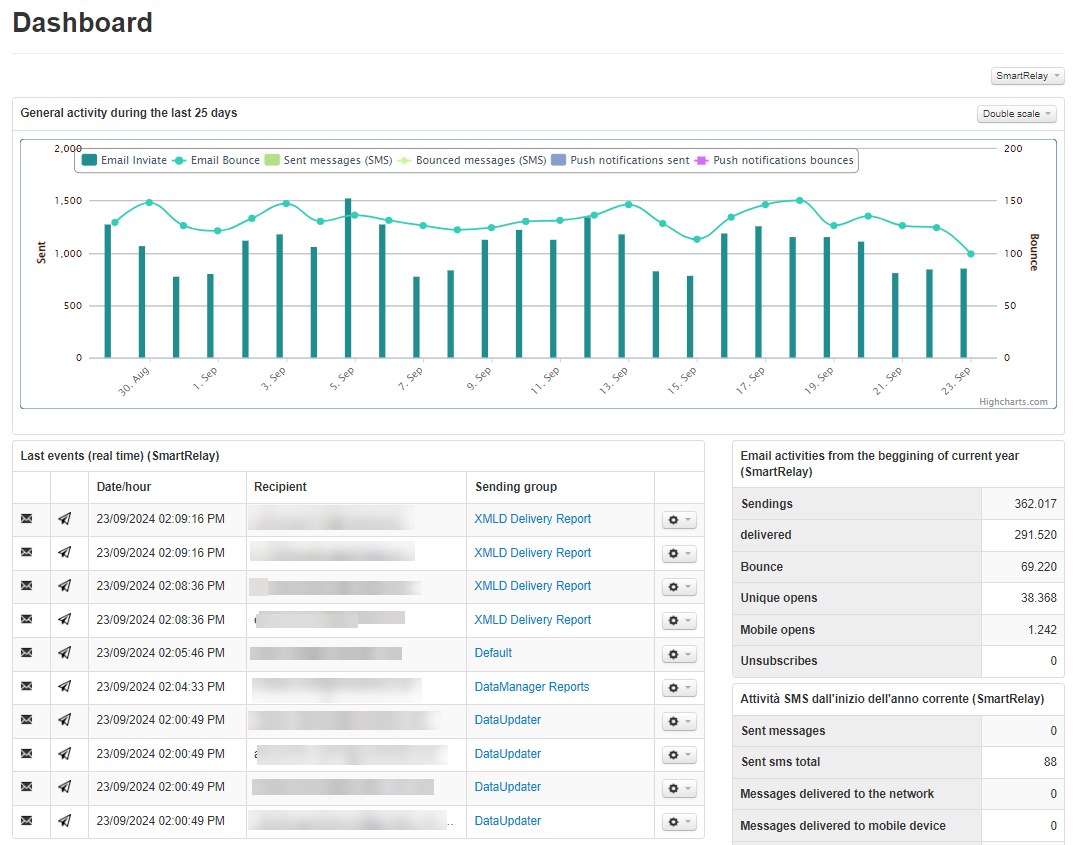
In the Dashboard, you can graphically view the trend of sent emails and bounces over the past 25 days, making any anomalies immediately visible.
It also shows the latest generated events (in real time) and a summary of the number of emails sent, delivered, bounced, and opened for the current year.
Download Section
In this section, you can download the requested files from various sections of the platform over the last seven days (e.g., reports). You can also view pending or ongoing requests (proprietary requests can be deleted).
Analyse
Delivery archive
The campaign archive collects all the sent emails, grouped by the campaign group ID. To access the statistics of a campaign, click on the Title of the campaign itself.
The statistics of a campaign are divided into tabs:
- Summary
- Sendings
- Views
- Click
- Radar
- Reports
Summary
This tab contains a summary of the campaign data and statistics on delivered and undelivered emails, the reasons for non-delivery, and the number of opened emails.
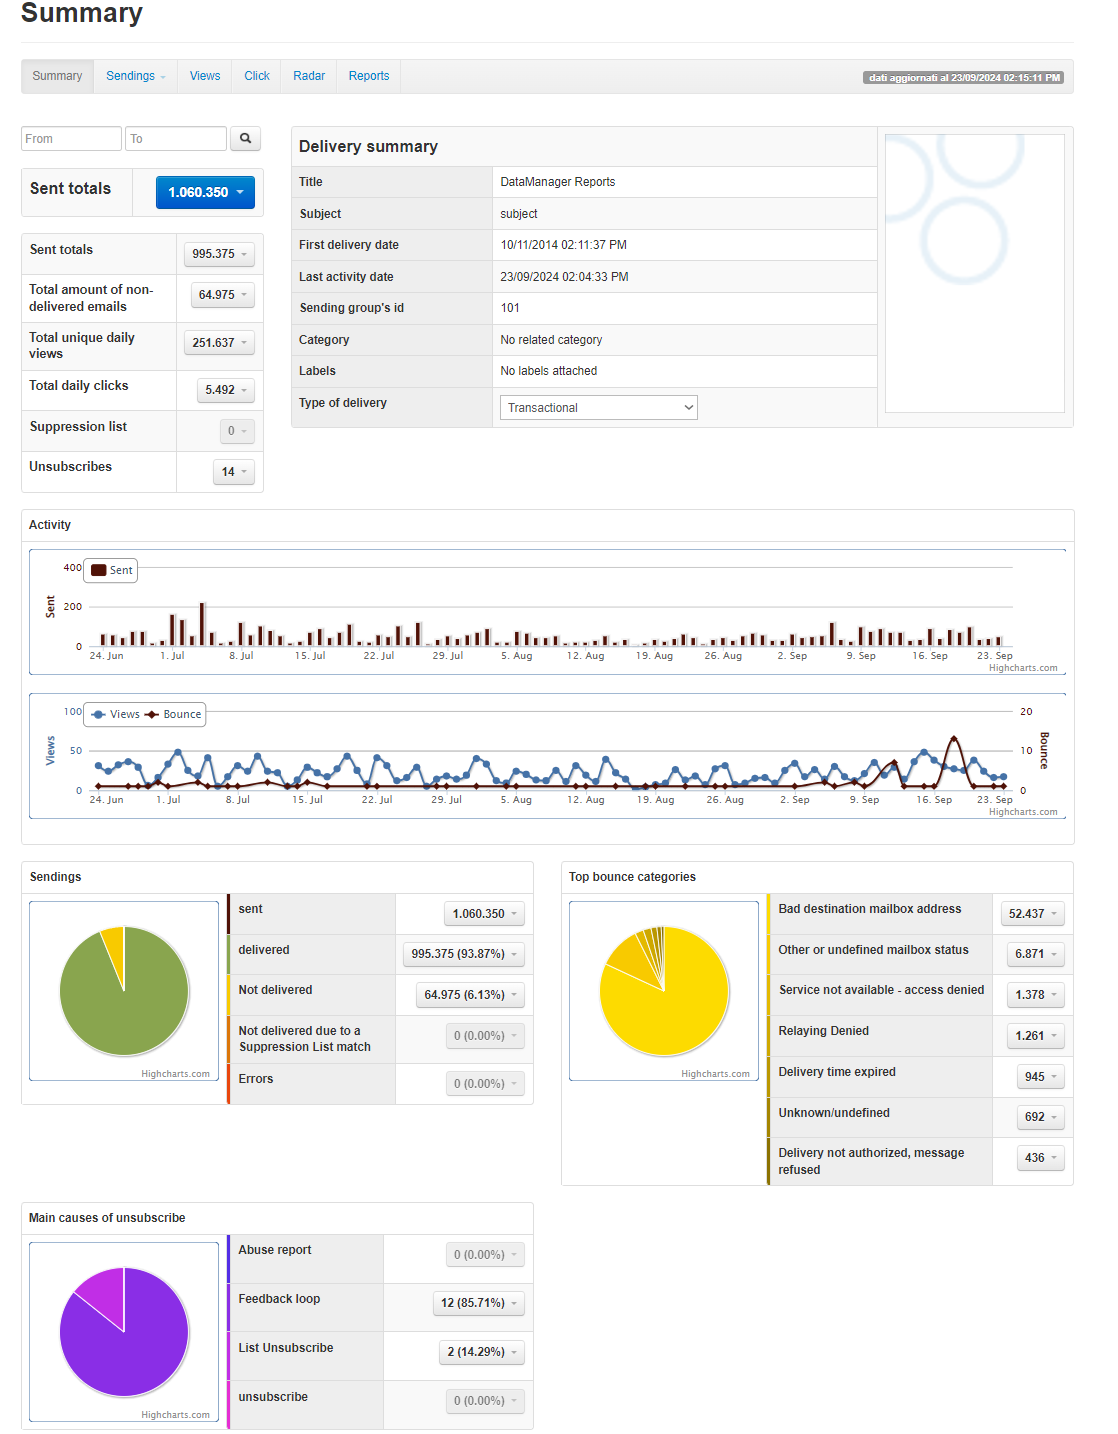
Other available features include:
- A search engine “From” > “To” to search for deliveries within a specific time range.
- Image upload, allowing you to associate an image with the campaign group for better identification.
By clicking the arrow to the right of Sent totals, Total amount of non-delivered emails, Total unique daily views, Total daily clicks, Suppression List,etc., you can directly go to the corresponding section and download the list of related emails.

Sendings
Here, the data on Sends is collected. In the submenus “Sent,” “Delivered,” “Undelivered,” “Errors,” “Suppression List,” the corresponding graphs and detailed statistical data are contained.
Sent
This section describes the data related to the sent emails. It includes: a graph showing the emails sent per domain and a curve showing the corresponding number of views.
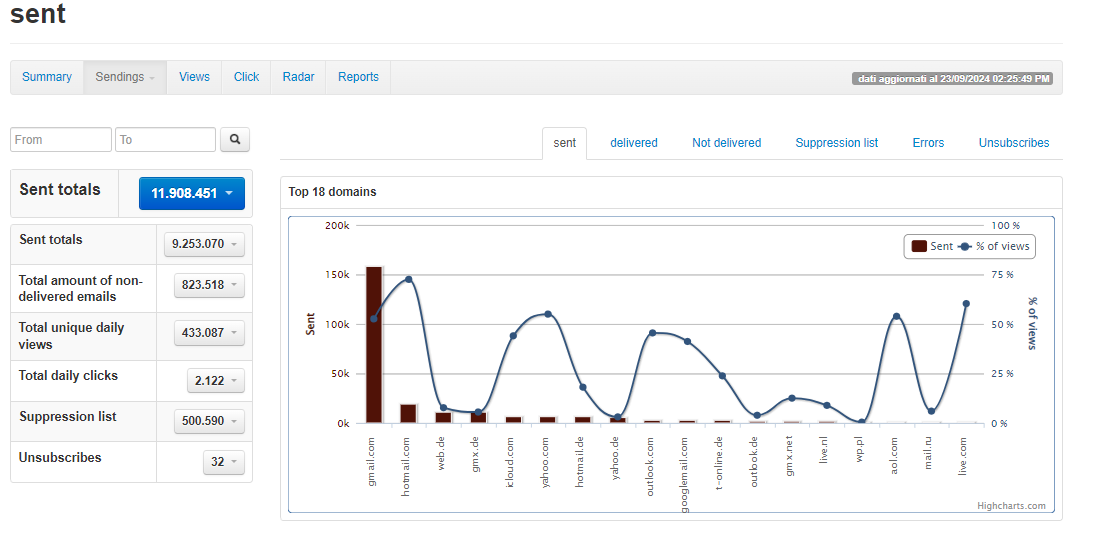
A table is also shown displaying domain analysis, showing for each domain the number of emails sent and delivered, undelivered, suppression list, errors (both absolute and percentage values).
You can modify the sorting based on your needs (by default, it is sorted by the number of sent emails).

Delivered
This section describes the data related to delivered emails. It features a graph showing the emails delivered per domain and a curve showing the "percentage of delivered" emails.
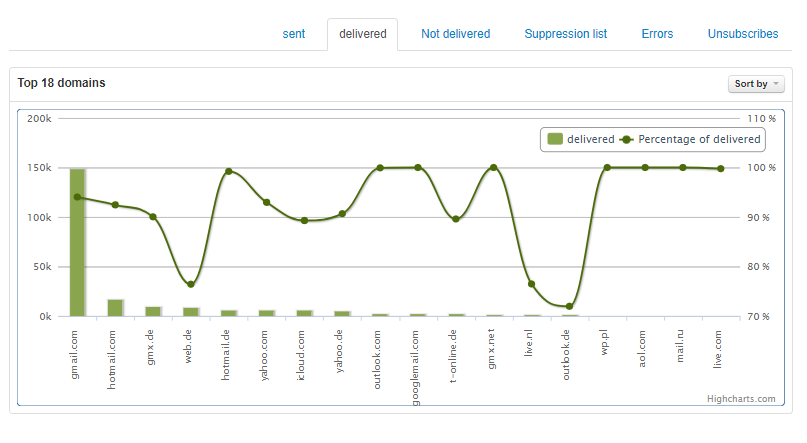
A table with domain analysis is also shown, indicating for each domain the number of emails sent and delivered, undelivered, suppression list, errors (both absolute and percentage values).
You can modify the sorting based on your needs (by default, it is sorted by the number of delivered emails).

Not delivered
In this tab, you will find statistics related to undelivered emails. It includes a graph showing the emails undelivered per domain and a curve showing the "percentage of sent" emails.
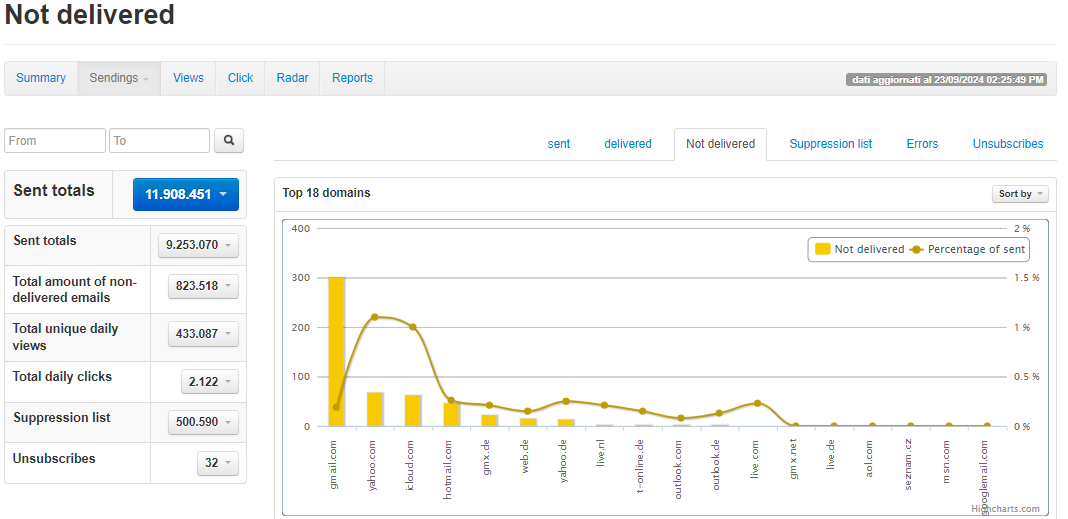
A table with domain analysis is also provided, showing for each domain the number of emails sent and delivered, undelivered, suppression list, errors (both absolute and percentage values). You can modify the sorting based on your needs (by default, it is sorted by the number of undelivered emails).

Finally, a graph highlighting the main reasons for non-delivery is available.
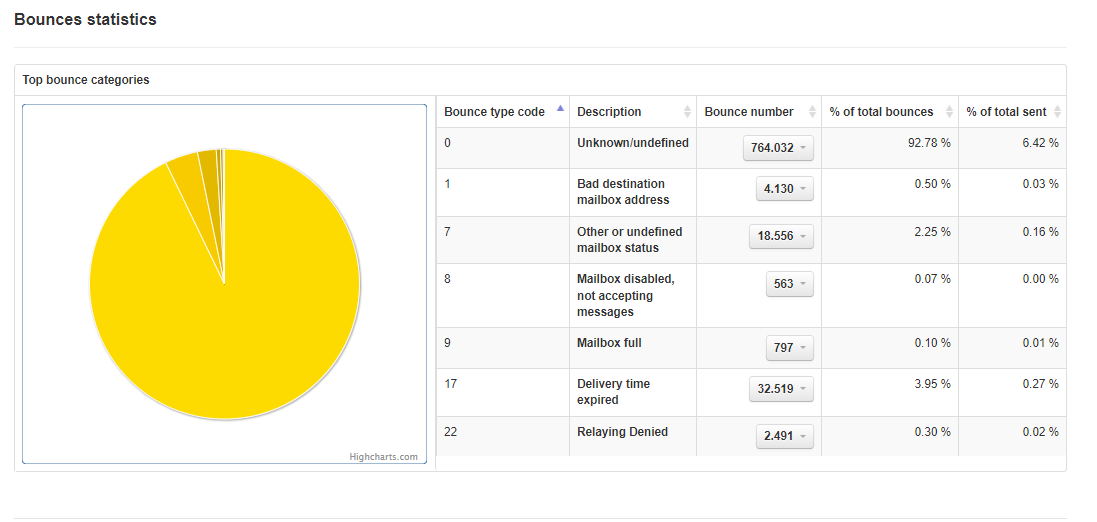
Legend of numeric codes identifying bounces:
- 0: Unknown/undefined
- 1: Bad destination mailbox address
- 2: Bad destination system address
- 3: Bad destination mailbox address syntax
- 4: Recipient Block Policy
- 5: Bad sender’s mailbox address syntax
- 6: Bad sender’s system address
- 7: Other or undefined mailbox status
- 8: Mailbox disabled, not accepting messages
- 9: Mailbox full
- 10: Message length exceeds administrative limit
- 11: Reputation block
- 12: No answer from host
- 13: Bad connection
- 14: Routing server failure
- 15: Unable to route
- 16: Routing loop detected
- 17: Delivery time expired
- 18: Other or undefined protocol status
- 19: Invalid command
- 20: Syntax error
- 21: Delivery not authorized, message refused
- 22: Relaying Denied
- 23: Service not available - access denied
- 24: Message considered to be spam
Suppression List
This section lists messages that were not sent because they were included in ContactLab's Blacklist. More information about the Blacklist can be found in the chapter Analyse → Blacklist” of this manual. A graph showing the emails in the blacklist per domain and a curve showing the "percentage of sent" emails is included.
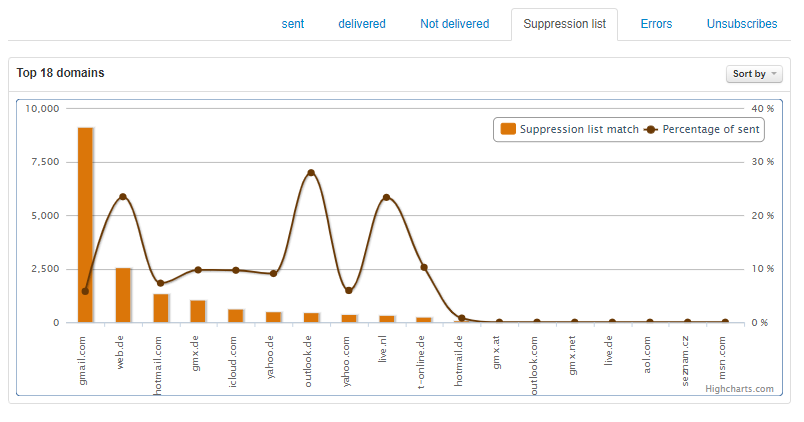
A table with domain analysis is also shown, showing for each domain the number of emails sent and delivered, undelivered, suppression list, errors (both absolute and percentage values). You can modify the sorting based on your needs (by default, it is sorted by the number of emails in the blacklist).

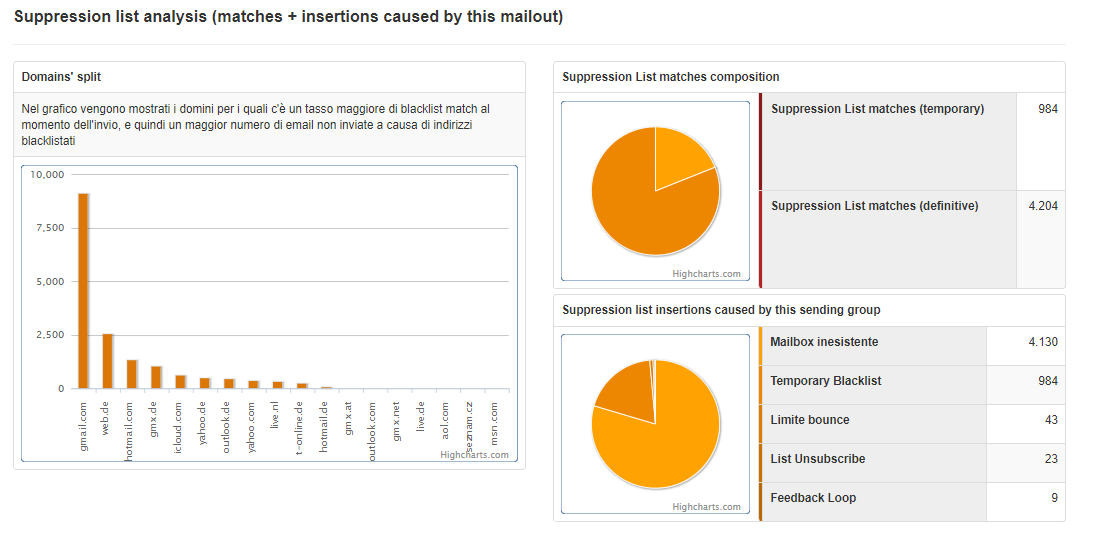
Finally, a graph is displayed representing the domains with a blacklist match greater at the time of sending, along with the composition of the blacklist at the time of sending (how many users were in the permanent blacklist and how many in the temporary blacklist) and the addresses added to the blacklist after sending.
Errors
Not available
Unsubscribes
In the “Unsubscribes” tab, various reasons for user unsubscription are reported, namely:
- Abuse: users who have reported abuse.
- Feedback loop: users who have marked the email as spam on certain ISPs, such as hotmail, aol, yahoo, etc.
- List Unsubscribe: this refers to an additional cancellation option included in the email header. It is a header containing a link that allows for automatic unsubscription from the newsletter. This is interpreted by some ISPs like gmail and hotmail, meaning that users who unsubscribe through their webmail's specific functionality are added to our blacklist with the reason “List unsubscribe.”
- Unsubscribe
Views
In the "Views" tab, statistical data related to:
- Views on top 18 domains.
- Last views (in real time).
- Other views details, such as "Total unique views", "Number of opens from mobile devices", etc.
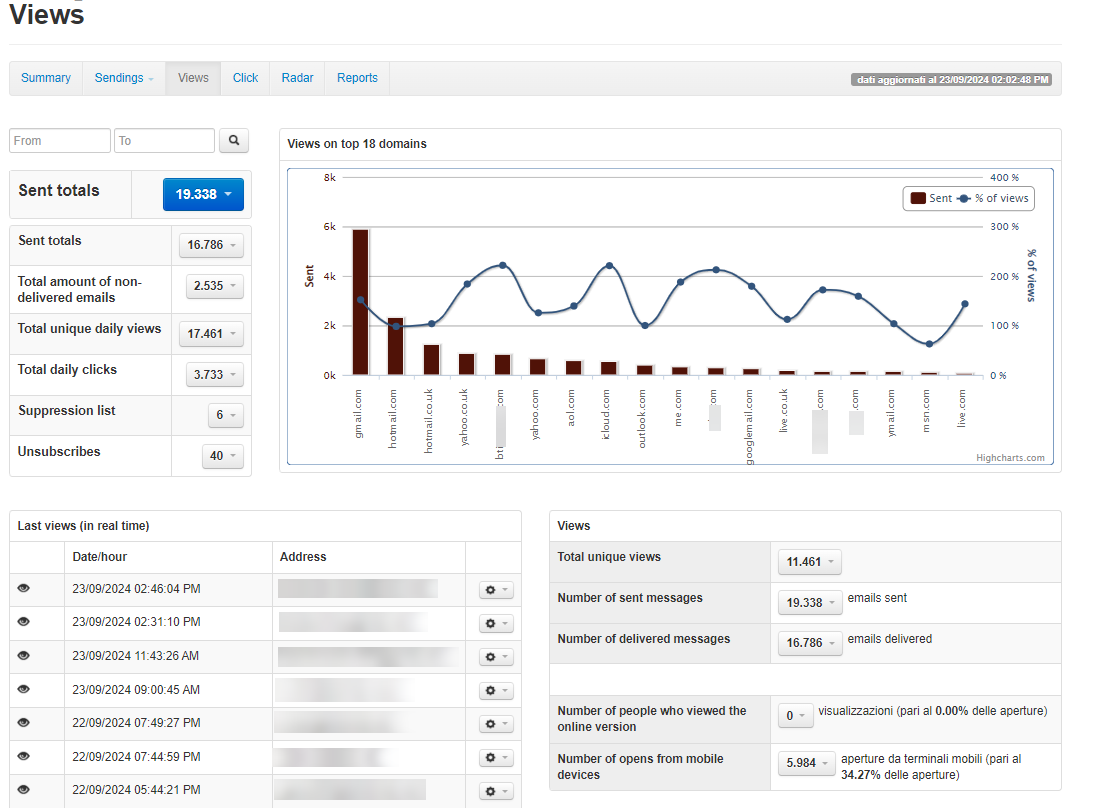
The latest email addresses of users who opened the campaign are also listed.
Clicks
In the “Clicks” tab, statistical data related to:
- The most clicked links with the total number of clicks.
- The last clicks (in real time).
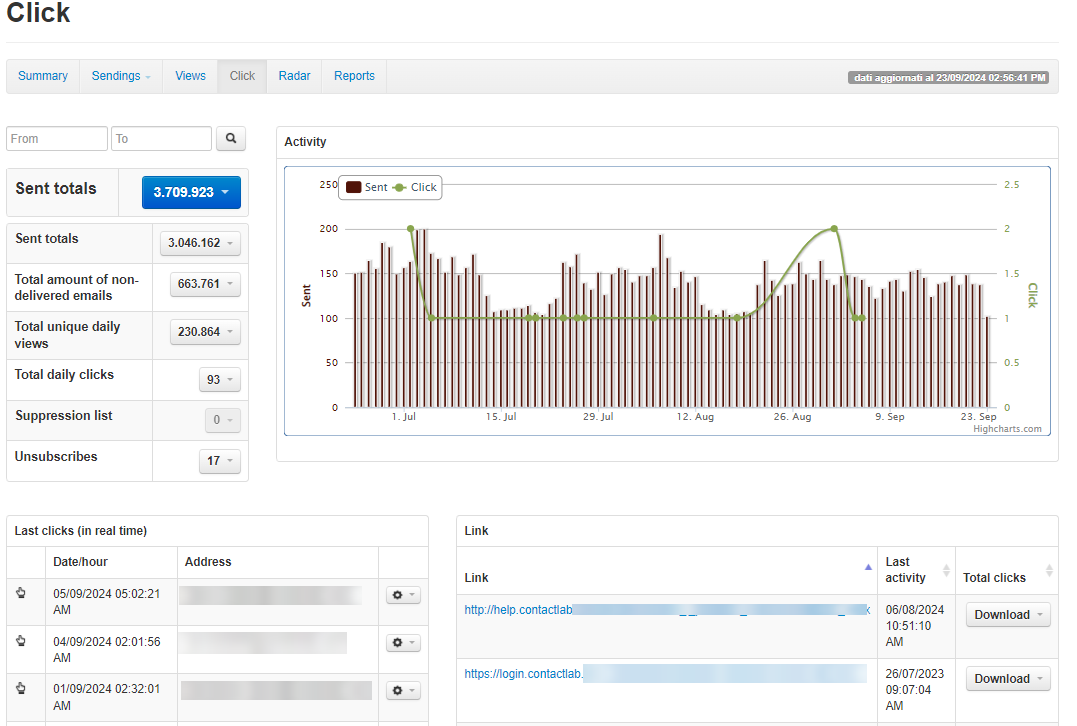
Radar
By entering an email address belonging to a user who received the message, the statistics related to that user will be displayed: whether the campaign was successfully delivered and whether it was opened.
Reports
Here, all reports related to the various tabs are collected: Summary, List of sent emails, List of delivered emails, List of bounces, and so on, so that those who wish to download one or more reports can do so without entering the specific tab, but simply by selecting it from the list.
The list includes descriptions explaining the type of analysis contained in each report.
Suppression List
The “suppression list” is a function introduced on the platform following the adoption by major national providers of “dynamic blacklisting” policies, a new tool to combat spam; its operation is as follows. When a certain number of messages are sent to non-existent email addresses within a given time frame, the server responsible for the sends is temporarily blocked, meaning that it will be impossible to send emails to real users as well.
Now, if campaigns are sent from the platform using databases containing many non-existent email addresses (perhaps because the database is a bit outdated), there is a risk that all sends to that provider will be blocked by the dynamic blacklisting system. To avoid this risk, the “suppression list” section has been introduced.
Its purpose is to create an internal blacklist on the platform, customized for each client.
In this way, sends to non-existent mailboxes will be drastically reduced, and the risk of incurring the “dynamic blacklisting” mechanisms will be significantly decreased.
There are two levels of blacklist on the platform: temporary blacklist and permanent blacklist.
According to the concept of temporary blacklist, depending on the frequency and type of bounce, users' email addresses will be entered into the blacklist with variable time criteria.
Specifically:
- Bounces for non-existent mailboxes will be added to the permanent blacklist upon the first occurrence.
- All other types of bounces (hard or soft) will generate the following behavior:
- 1st bounce: Address added to temporary blacklist for one week after which it will be removed, returning to availability for sends.
- 2nd consecutive bounce: Address added to temporary blacklist for two weeks after which it will be removed, returning to availability for sends.
- 3rd consecutive bounce: Address added to temporary blacklist for four weeks after which it will be removed, returning to availability for sends.
- 4th consecutive bounce: Address added to the permanent blacklist.
It is possible to verify if an address is already blacklisted or to add it to the blacklist by filling out the Note field if desired.
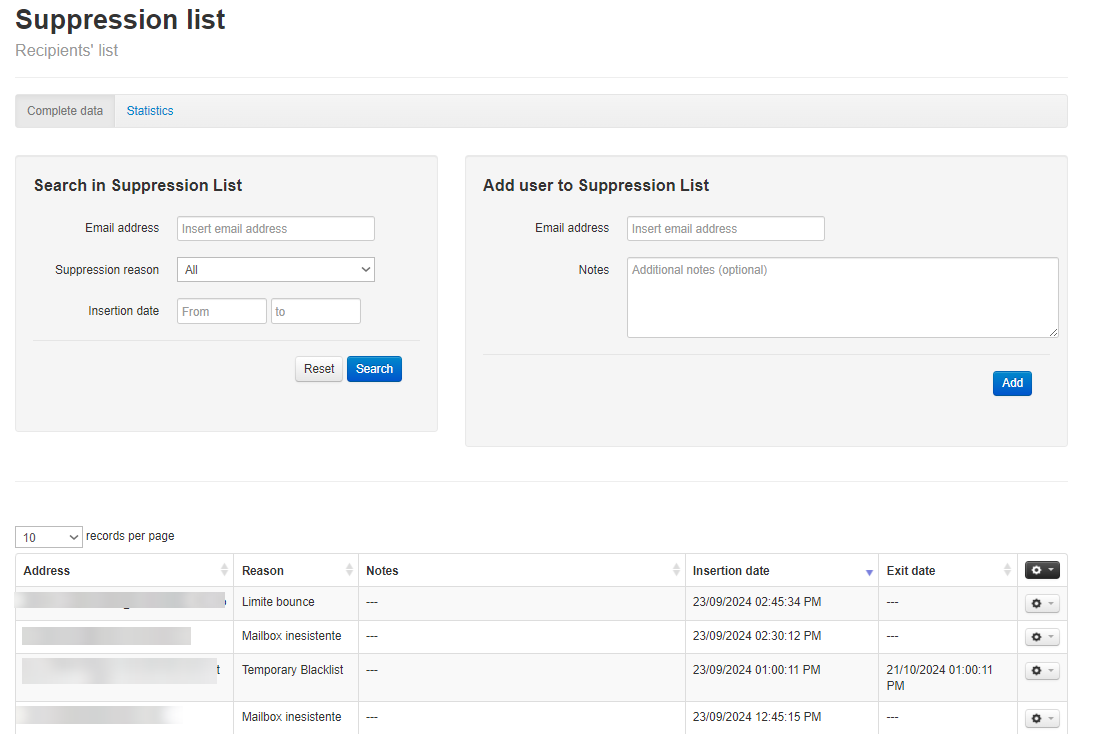
The latest users added to the blacklist are also displayed.
In the “Statistics” tab, graphs related to the composition of the suppression list are shown, analyzing vertically the different types of bounces that caused entry and the number of consecutive bounces related to addresses currently in the temporary suppression list and the progressive trend of reinserting addresses in the temporary blacklist.
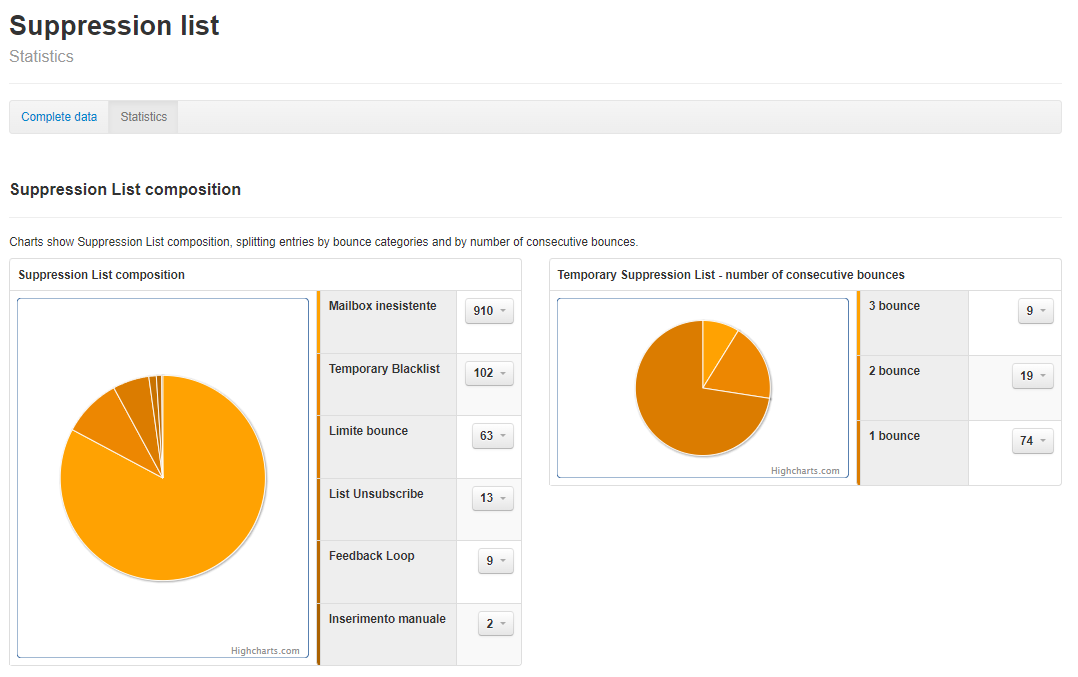
Trend for recipient domains
The "Trend for recipient domains" section provides a tool for analyzing the performance of emails sent to various destination domains. This analysis is essential for monitoring and identifying any deliverability issues.
Main components:
- Search field: Allows you to search for and filter the domains displayed in the table bel**ow, facilitating management and analysis of specific domains.
- Select series to analyse: Allows you to choose the type of data to be displayed and analyzed in the report (Sendings, Bounces, Views, Blacklist, Unsubscribes)
- Date range: Selects the time frame for the analysis, ranging from 1 week (1W) to 6 months (6M).
- Data visualization mode: Allows you to choose how to visualize the data in the graph. "Separate Domains" shows the data individually for each domain, while "Collapsed Domains" aggregates the data.
- Bounce type: Allows you to filter bounce types for analysis. Types include "Hard," "Soft," "Delivery Time Expired," "Unknown" (unknown), "Reputation/Spam," and "Other" (other).
User Activity Analysis
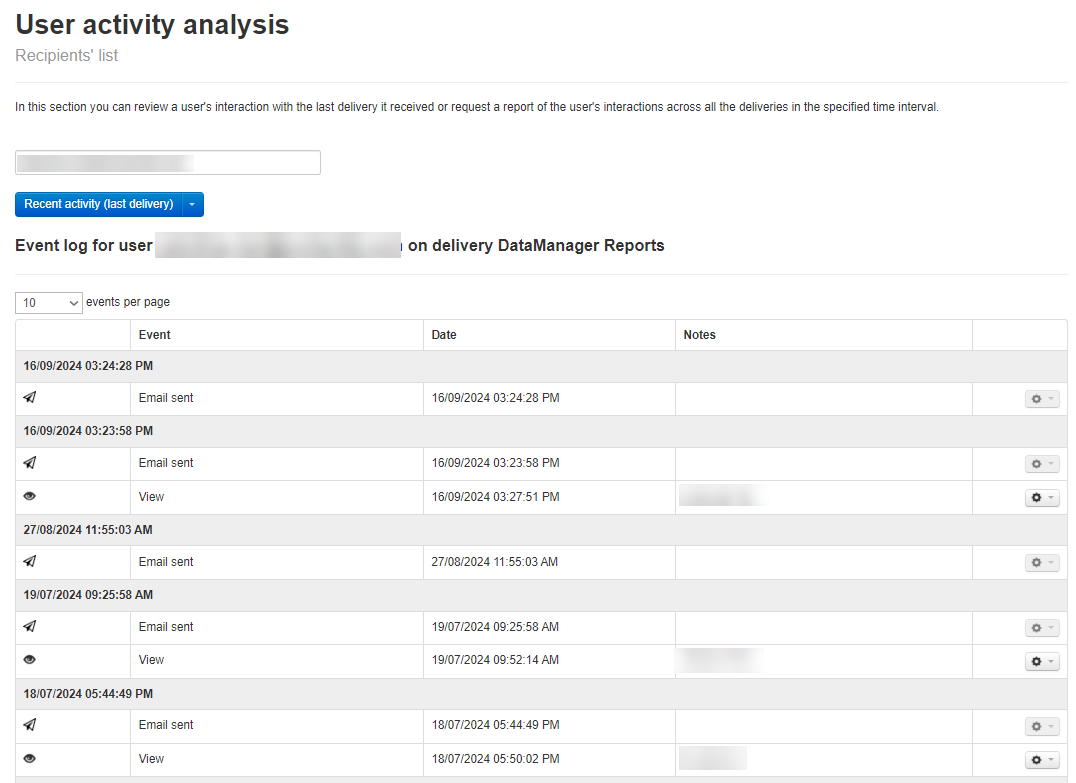
In this section, you can monitor recent user activities related to the received campaigns or request a detailed report of all received campaigns over a specific time frame (last week, last month, last 3 months, last 6 months, last year).

Recent Activity
It is possible to view, for the single user, the details of the latest campaigns (sending date, type of action, event date, IP):
Download Report
Alternatively, you can generate a report that will contain the details of the campaigns for the single user, for the last week, month, 3 months, 6 months, last year.
Once the file is ready, it can be downloaded in the "Download" area.