Special reports
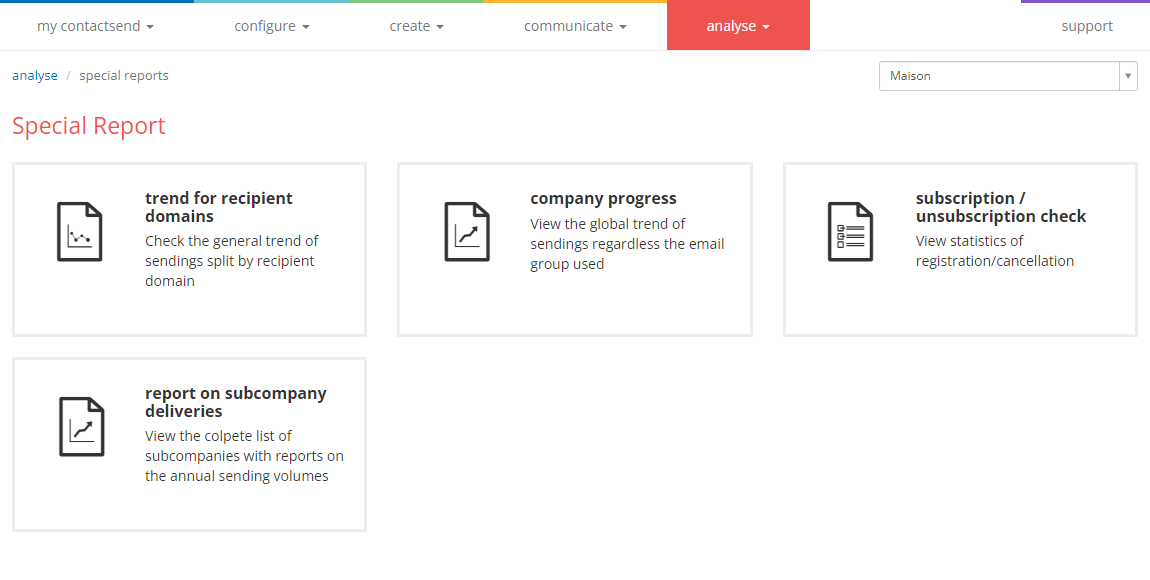
In the section Analyse > Special reports, the following information is available:
- Trend for recipient domains
- Company progress
- Subscription/Unsubscription check
- Report on subcompany deliveries

Trend for recipient domains
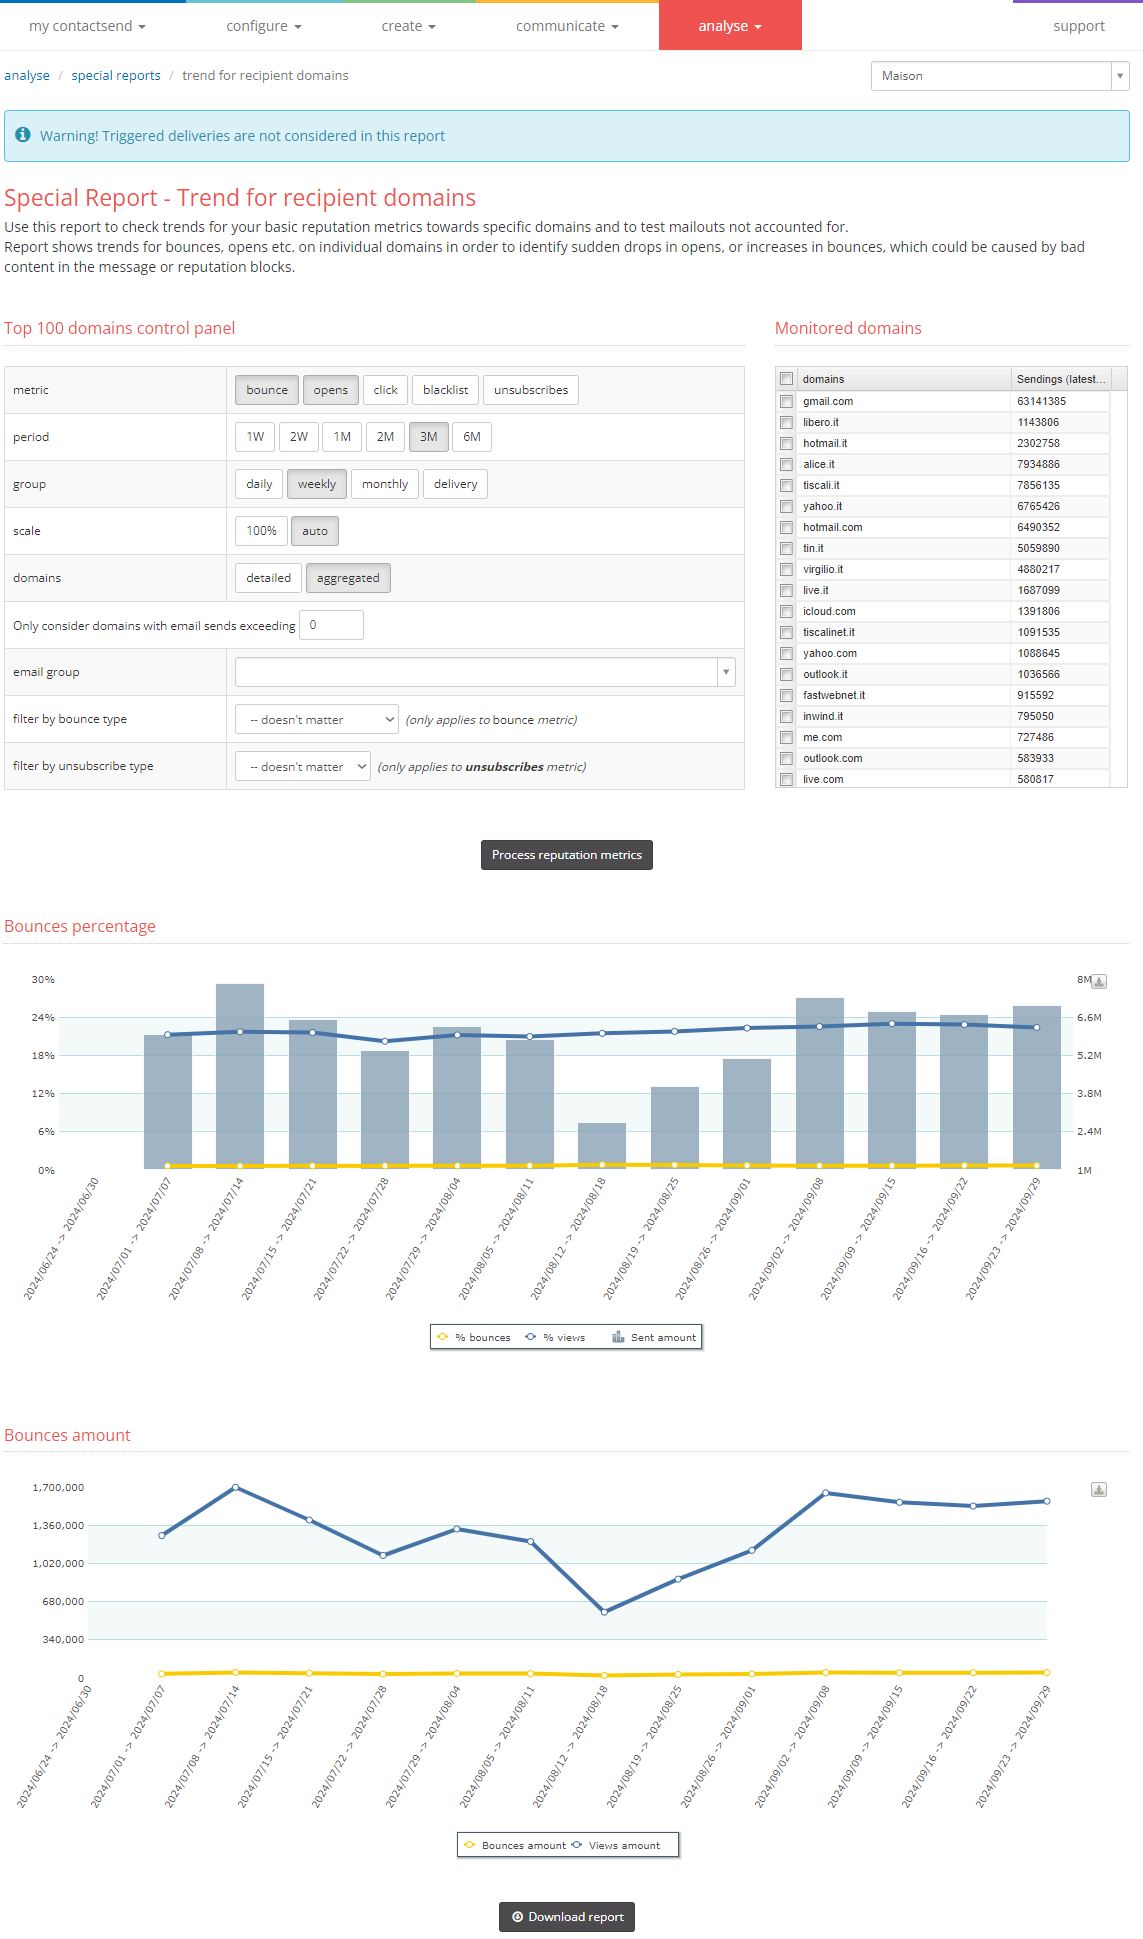
On this page, you can check the overall performance of deliveries to individual domains.
The top 100 most relevant domains for each customer are reported. The graphs represent the performance of events, such as bounces and opens, on individual or all domains, allowing you to identify any sudden drops in opens or, conversely, any increases in bounces.
The analysis can be carried out in detail by selecting:
- Metric: one or more events tracked by the platform, such as bounce, opens, click, blacklist, or unsubscribes.
- Period: the time frame for analysis, such as one week, two weeks, one month, two months, three months, or six months.
- Group: how to group the data, whether by day, week, month, or delivery.
- Scale: the scale at which the graphs will be displayed, either 100% or automatic.
- Domains: whether to display the graph with expanded domains (one line for each domain) or collapsed (a single line for all domains).
- Only consider domains with email sends exceeding: the minimum number of recipients to consider, useful for excluding small deliveries that might skew the percentages.
- Email Group: the email group on which to perform the analysis.
- Filter bounce types: the type of bounce to analyze, whether soft bounce, hard bounce, etc.
- Filter by unsubscribe type: the type of "unsubscribe" to analyze, such as feedback loop, unsubscribe, abuse report, list unsubscribe.

Company progress
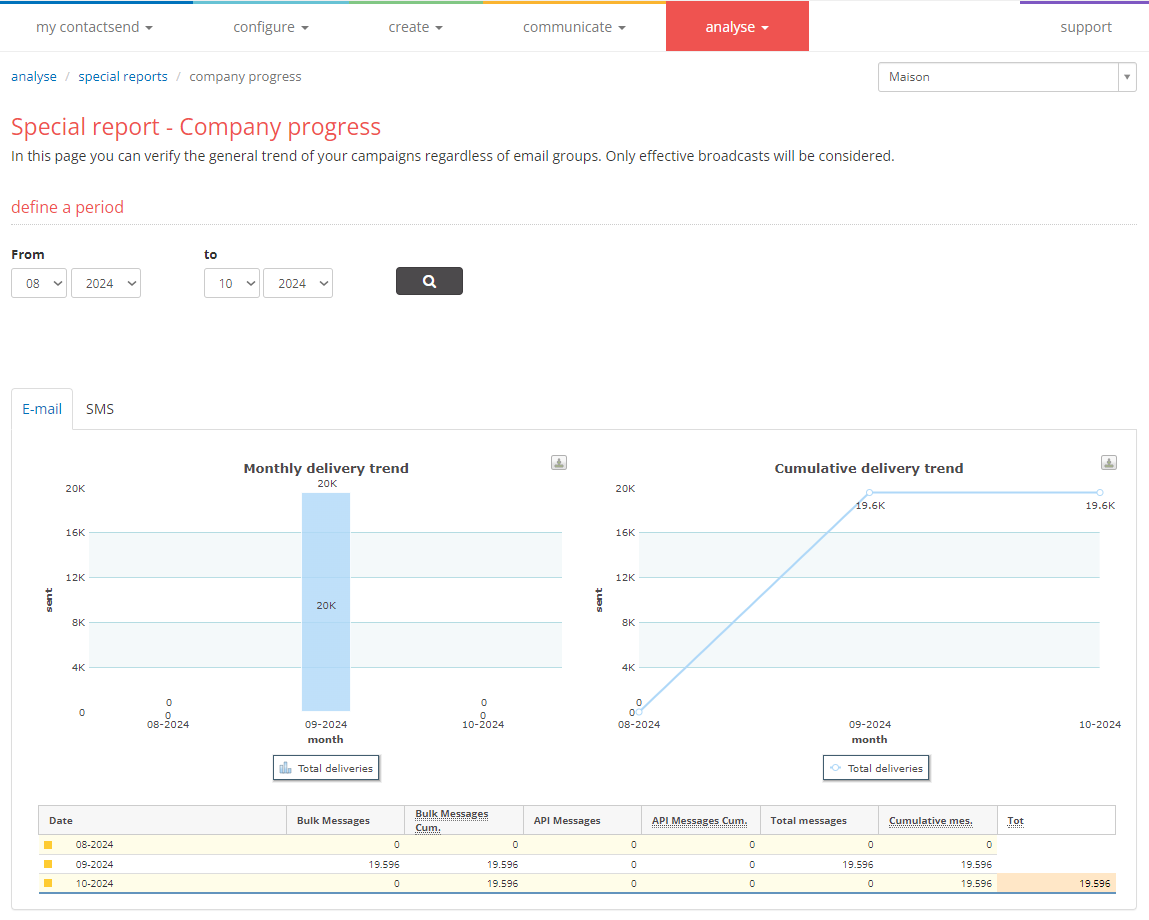
This report shows the overall performance of deliveries regardless of the group. You can check your company's mailing/SMS volumes:

Select the start and end date for the analysis period and perform the search.
In the first part of the screen, there is the Monthly delivery trend chart. Each bar represents the total deliveries for the month indicated on the horizontal axis (x), with the number of deliveries on the vertical axis (y).
In the second chart, Cumulative deliveries trend, the line represents the cumulative total of deliveries up to the indicated month.
Below, a table provides a detailed summary of messages by month, with specifics on various types of messages.
Subscription/Unsubscription check
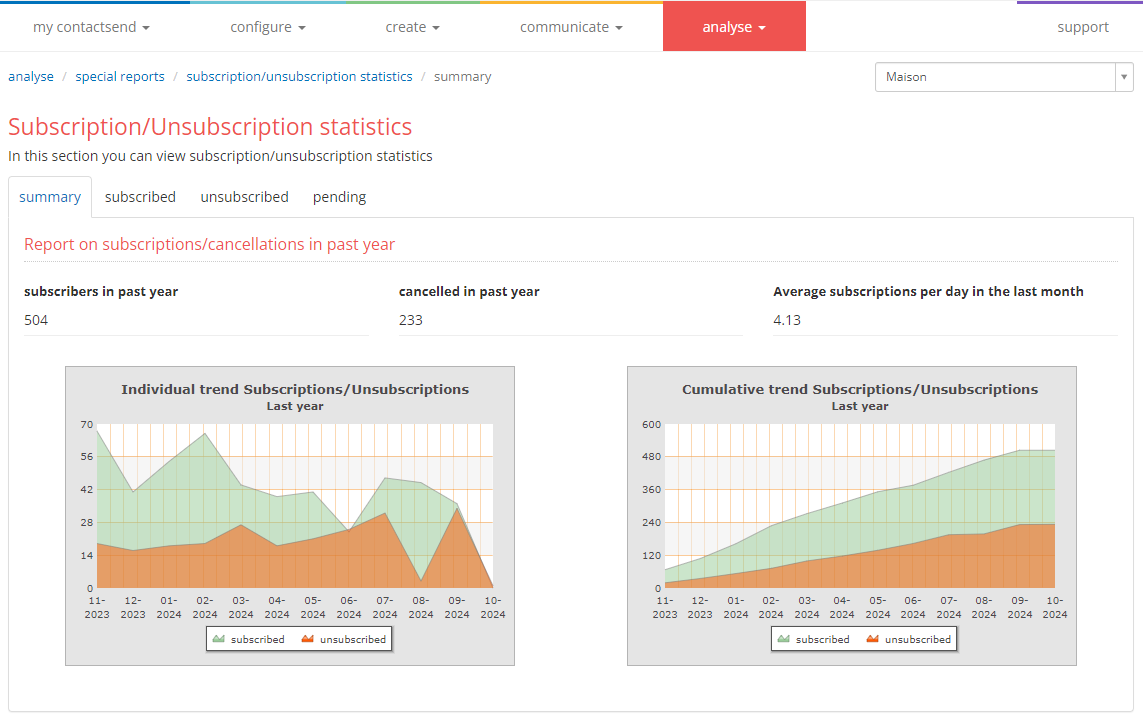
This report summarizes the performance of subscription/unsubscription/pending forms associated with your company's groups.

There are four tabs: Summary, Subscribed, Unsubscribed, Pending.
In the Summary tab, two graphs summarize the subscription/unsubscription trend over the last year (individual, cumulative).
In the "Subscribed" tab, you can view the list of subscribed users, with email address, subscription date, and email group. You can download the report by clicking on the Download subscription list button, available for download in the my contactsend > download area. The report includes the following information: email, user pk (user ID), event date, newsletter (email group name), subscription ID (subscription system ID).
In the "Unsubscribed" tab, you can view the list of unsubscribed users, with email address, subscription date, and email group. You can download the report by clicking on the Download unsubscription list button, available for download in the my contactsend > download area. The report includes the following information: email, user pk (user ID), event date, newsletter (email group name), subscription ID (subscription system ID), delivery ID (delivery ID).
In the "Pending" tab, users who have not confirmed their subscription are listed, with email address, subscription date, and email group. You can download the report by clicking on the Download waiting list button, available for download in the my contactsend > download area. The report includes the following information: email, user pk (user ID), event date, newsletter (email group name), subscription ID (subscription system ID).
Report on subcompany deliveries
If the company under analysis has subcompanies, it will be possible to monitor the overall performance of the subcompanies.