Audience overview
In the Segments > Audience overview section, it is possible to find dashboards and reports dedicated to:
- Customers
- Events
- Influenced purchases
- Fields distribution
All dashboards are available for the entire database. The Customers and Events dashboards are also available for individual segments.
The display of certain types of charts and/or dashboards depends on the initial platform setup.
Customers
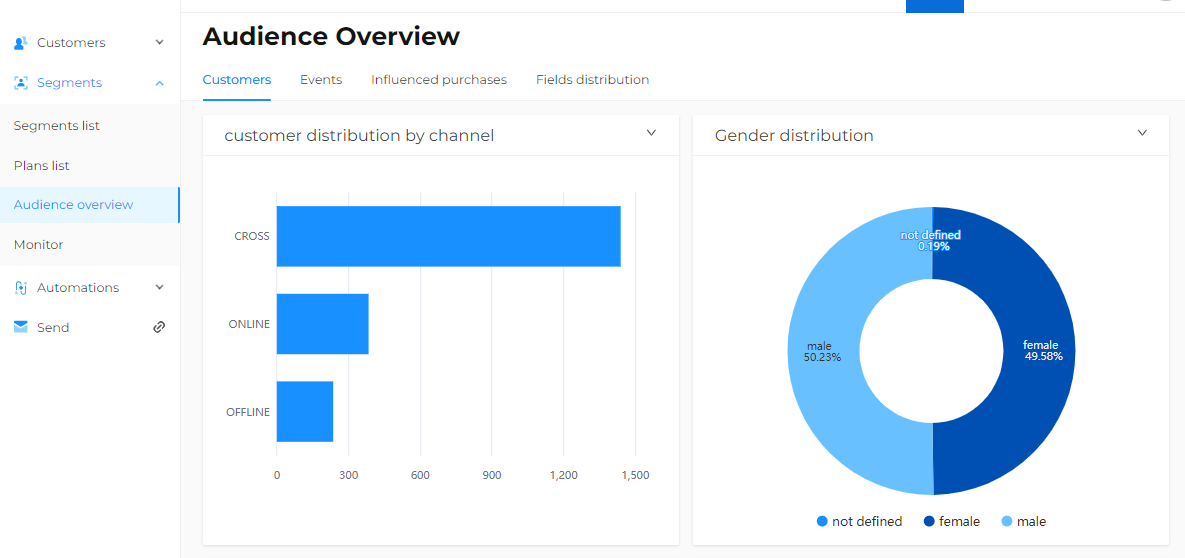
At a demographic level, the distributions of customers across specific configured demographic fields are shown.
By default, the following are displayed:
- Purchase distribution by sales channel
- Distribution by age
- Distribution by gender
- Geographical distribution
These fields can be modified upon request based on the information available in the customer profile.

Events
The main types of events covered by this dashboard are:
- Purchases
- Page views
- In-store visits
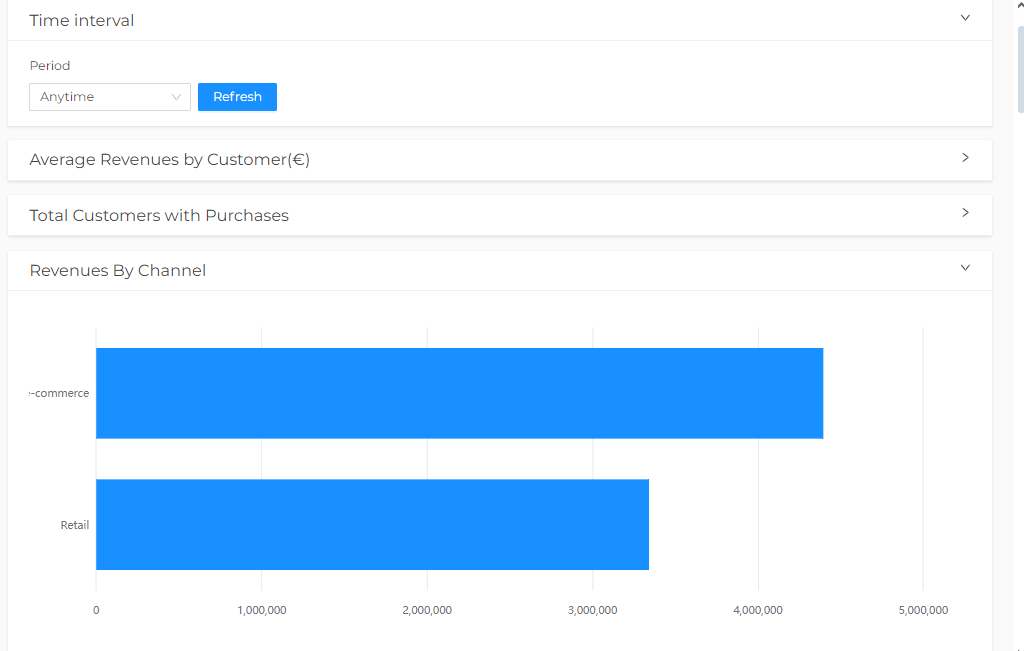
Once inside the dashboard, under Time Range, select one of the following options:
- Anytime: this is the default view.
- In date range: the dashboard includes data between two selected dates.
- In the last: the dashboard includes all data, for example, in the last year.
By selecting the desired range or appropriate historical period and clicking Update, the dashboard will be refreshed.

Influenced purchases
The configuration of this dashboard allows the verification of how a schedule has influenced purchasing behavior and revenue. By selecting two schedules, it is possible to compare their performance and determine which was more successful.
Fields distribution
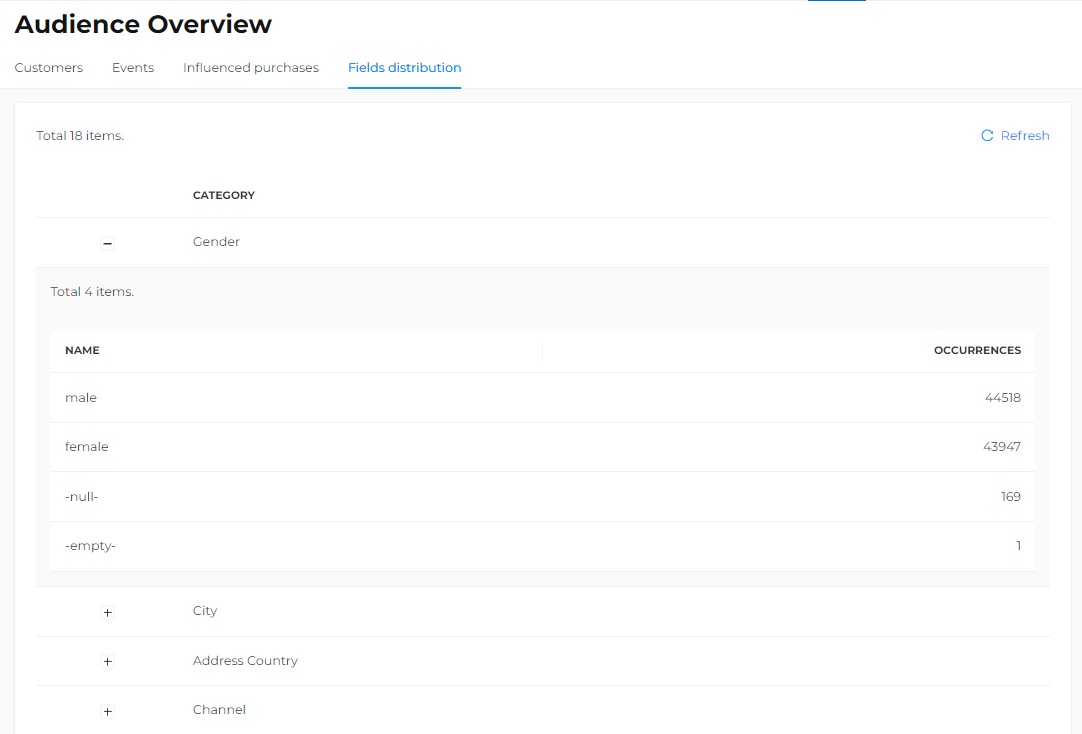
In this area, up to 20 values of the selected demographic fields, made visible by the user during the segment creation phase, can be displayed. The highlighted data includes the field name as written and the count. For example, considering the Gender field, it is possible to find Female, Male, M, F, m, f, -null-, etc., depending on how it was handled during data entry.
For a field to appear, it must be Enabled in the Settings > Segments > Field settings section.
Each page displays the details of three fields in the order in which they are available for segmentation. Additional results can be navigated by scrolling through subsequent pages.
Thanks to this new feature, maximum visibility of the value distribution within database fields is achieved, making it possible to:
- Immediately visualize the composition of the database.
- Perform an initial analysis of the quality of the existing fields.
- Identify any anomalies simply and quickly.
