Events KPI
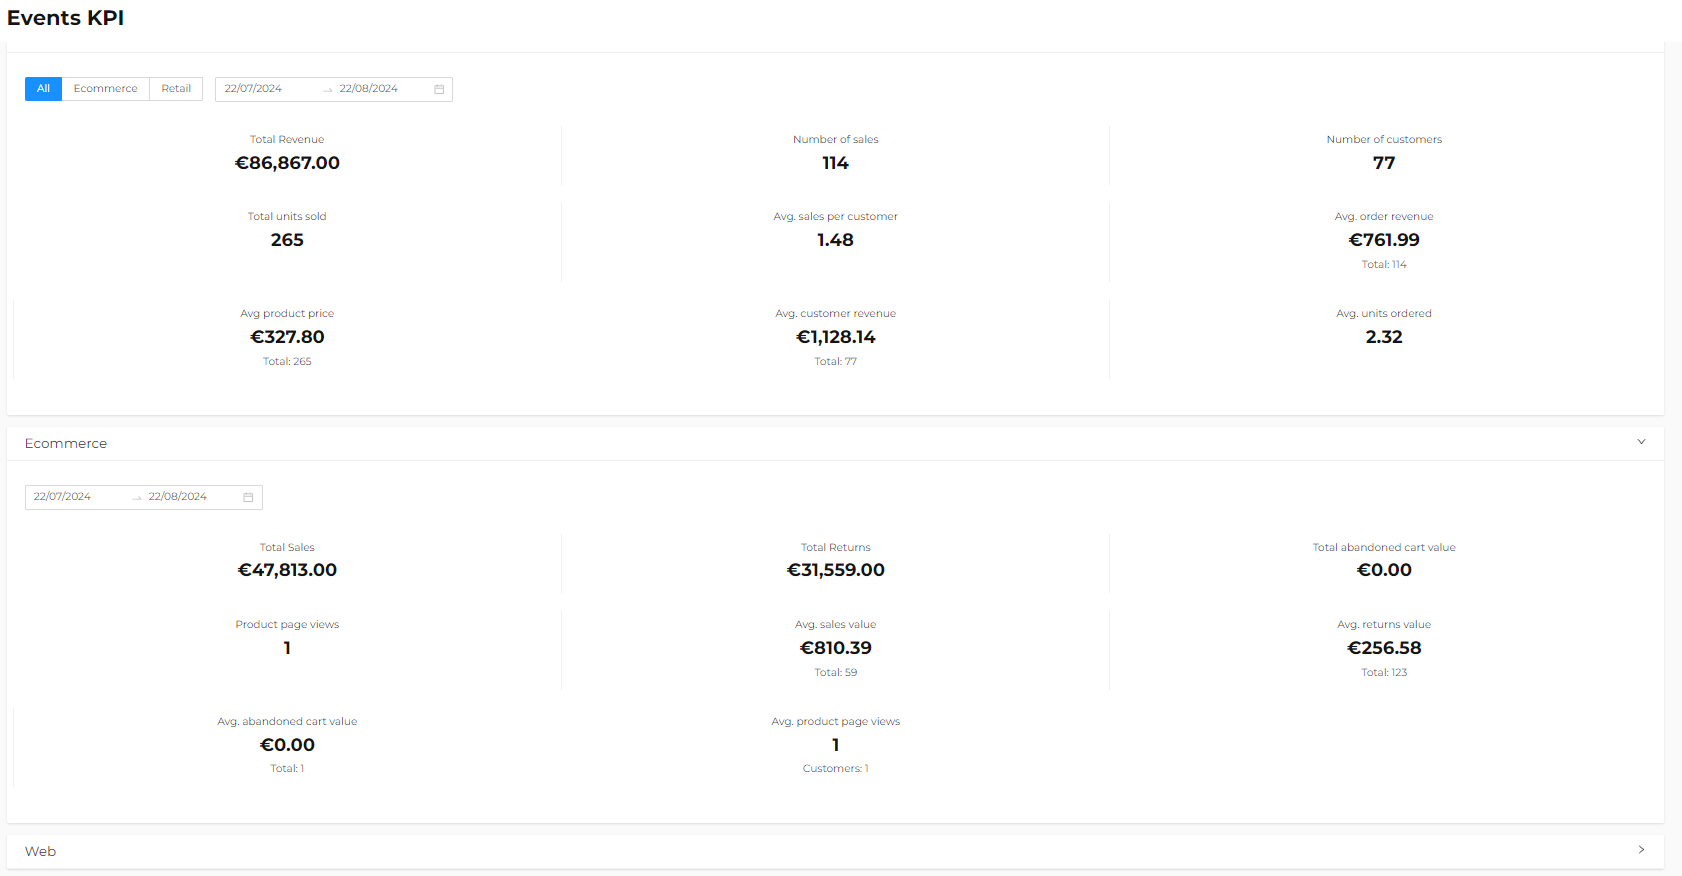
The Customers > event KPIs section provides access to key sales KPIs in one place and allows you to view details of purchases made in a specific context or over a defined period.
The dashboards summarize data on:
- Overall purchases, both ecommerce and retail.
- Details of the ecommerce context.
- Details of the web context.

Purchases
Information is available both in aggregate and broken down by context (All, Ecommerce, Retail). It is possible to define the analysis period by adjusting the dates in the calendar. The available data includes:
- Total revenue (total income value net of returns)
- Number of sales (number of orders in the selected period)
- Number of customers (number of customers who made a purchase in the selected period)
- Total units sold
- Average purchases per customer
- Average order revenue (average revenue per order)
- Average product price
- Average revenue per customer
- Average units ordered

Ecommerce
The dashboard shows the following information related to the ecommerce context. It is possible to define the analysis period by adjusting the dates in the calendar:
- Total sales
- Total returns
- Total abandoned cart value
- Product pages views
- Average sales value
- Average returns value
- Average abandoned cart value
- Average product page views

Web
The dashboard shows the following information related to the web context. It is possible to define the analysis period by adjusting the dates in the calendar:
- Page views
- Visitors
- Visitors per page