Analytics
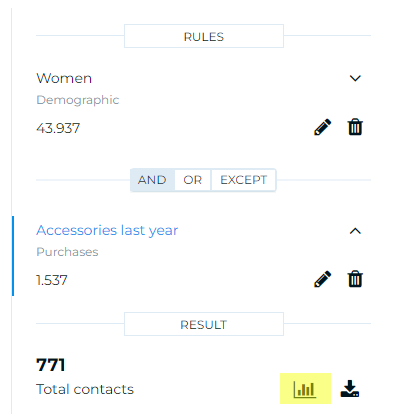
To view the dashboards that may have been configured for a given segment, access the Summary Panel of the segment of interest and click on the Analytics icon.

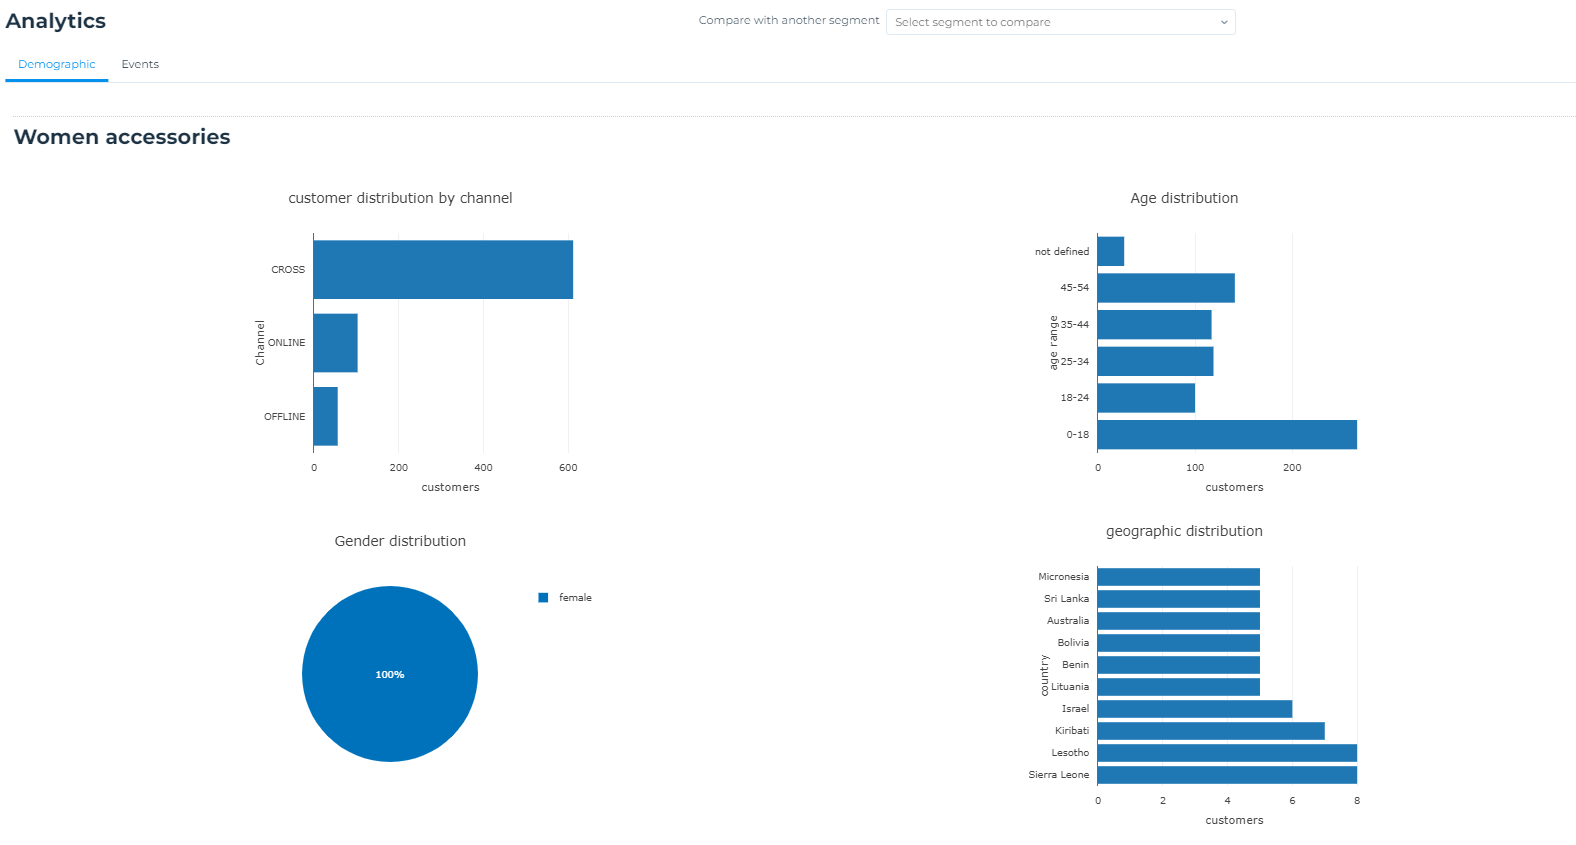
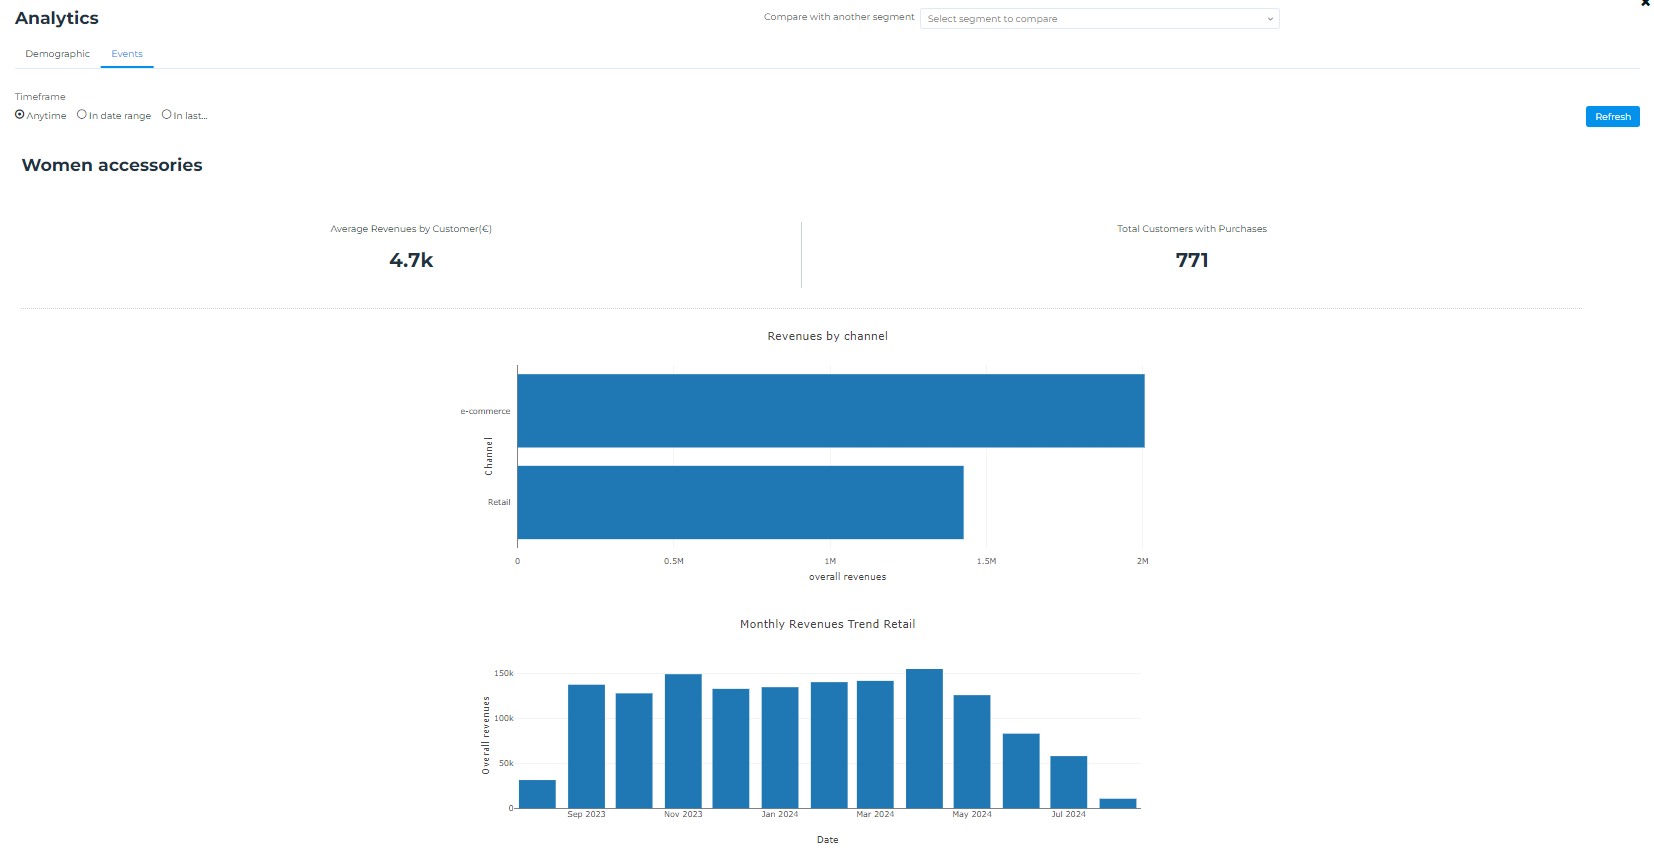
The dashboard for the reference segment will be displayed with two tabs, Demographics and Events, where detailed data and charts can be viewed. For Events, select the relevant time period.


This allows for an overview of the distribution of the selected target both in terms of socio-demographic characteristics (e.g., age, gender, country, etc.) and events such as revenue generated, purchase channel (retail or ecommerce), products purchased, etc.
The display varies based on the data loaded onto the platform and the initial setup.
Comparing segments
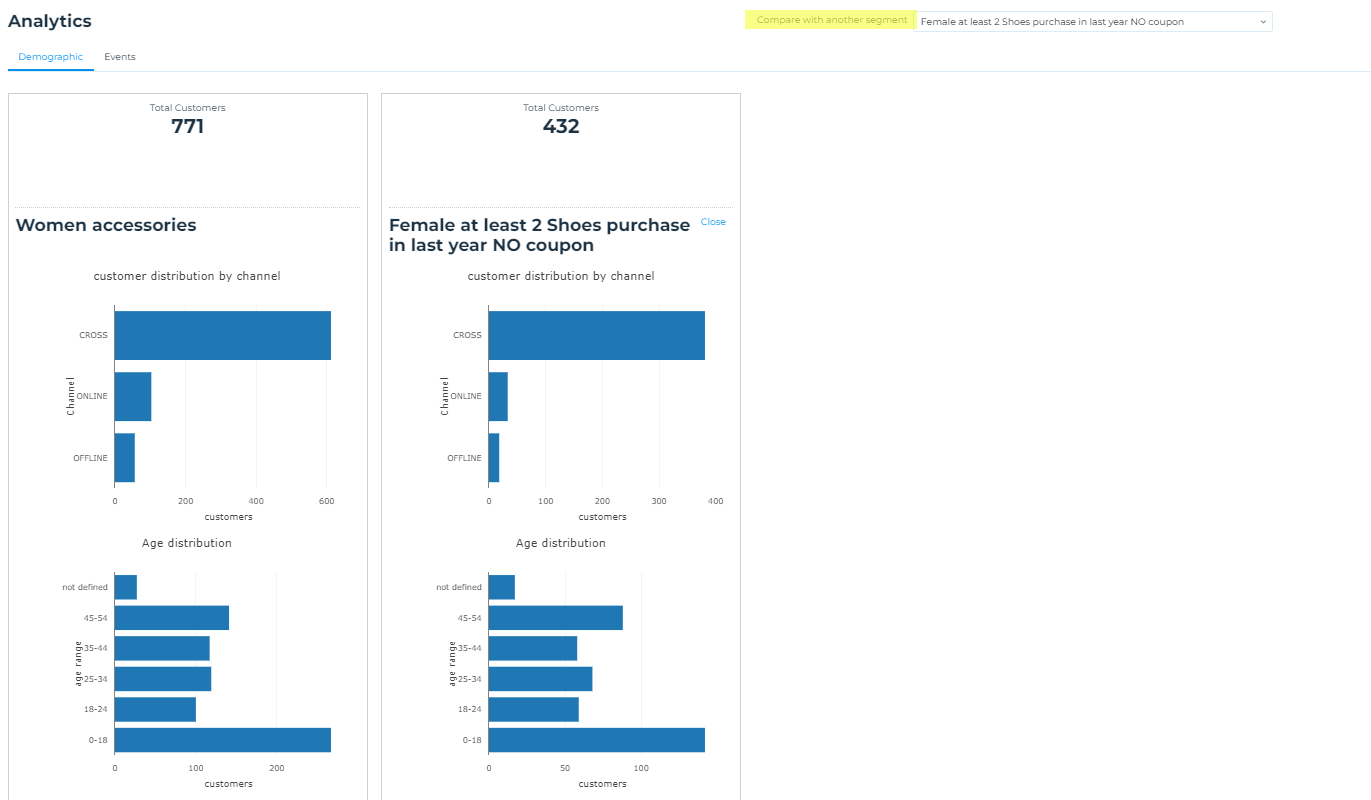
It is also possible to compare one segment with another.
Access the Summary Panel of the first segment and click on the Analytics icon.
The dashboard for the reference segment will appear with two tabs, Demographics and Events, and in the top right corner, there is a field to select the second segment to compare. Once the segment is selected, the charts for both segments will be displayed shortly after.
