Campaign archive
To access the statistics of a campaign, click on the title of the campaign itself.
The statistics of a campaign are divided into tabs:
Summary
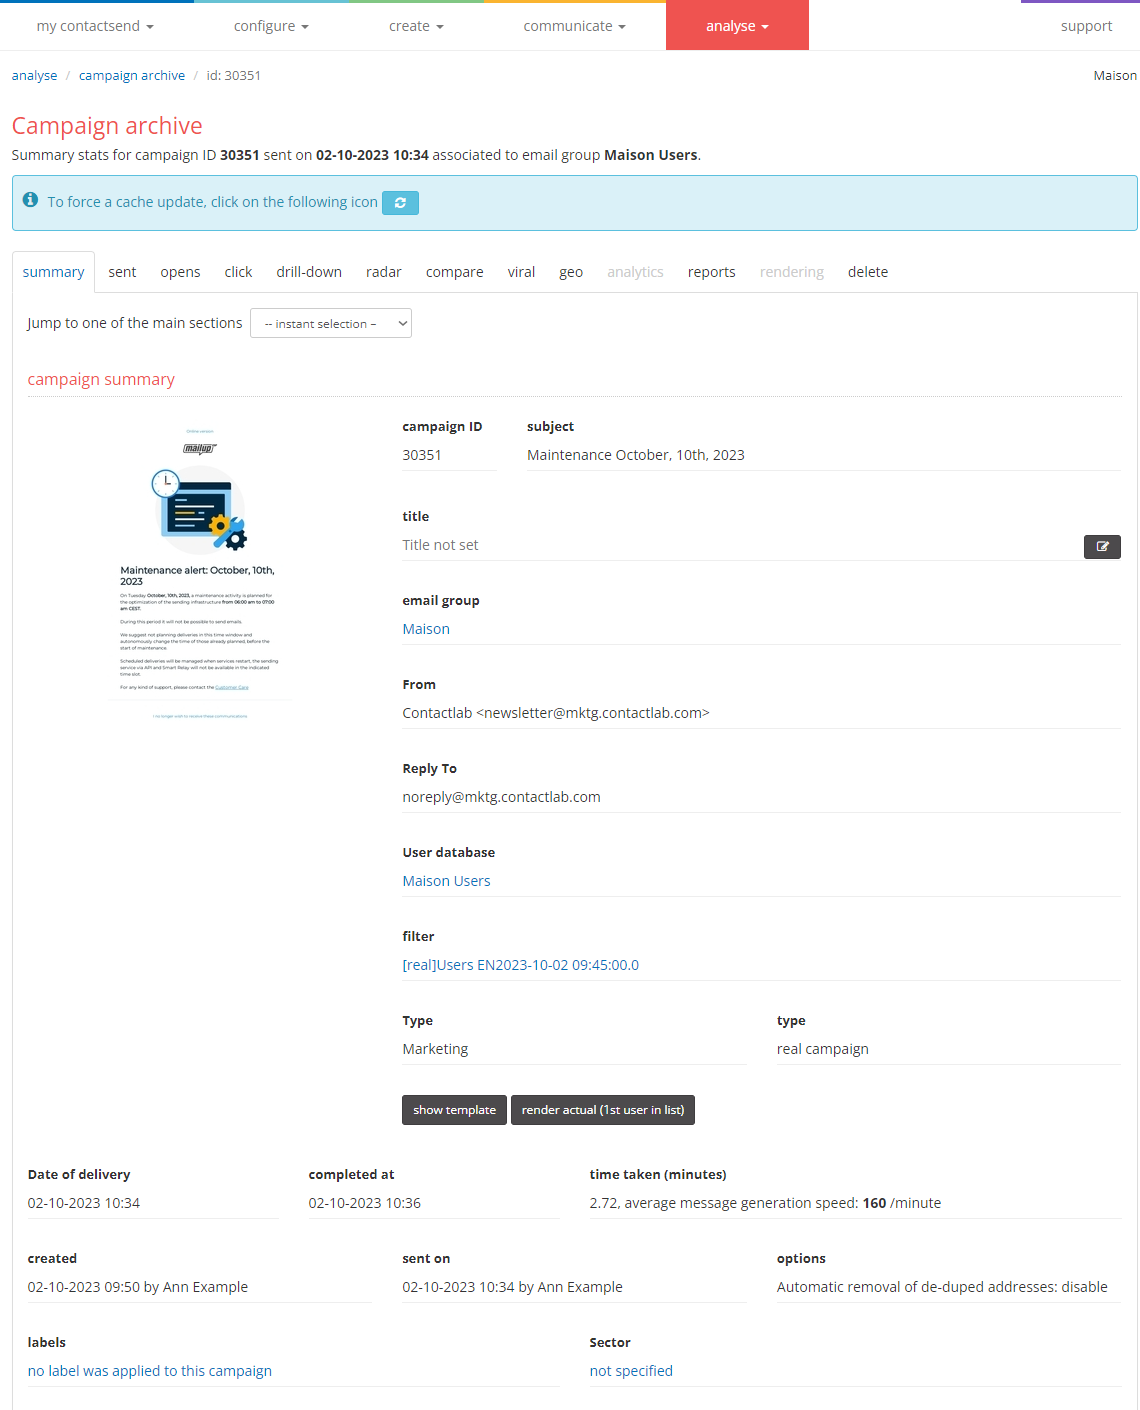
This tab contains a summary of the campaign data and statistics on delivered and undelivered emails, reasons for non-delivery, the number of emails opened, and link tracking.
In this section, you can modify the title of the campaign if it was specified during creation, or set it if it was not previously indicated.
Instant Preview on Different Clients
The instant preview system shows the message as displayed on various clients and operating systems. By clicking the Open preview button, the last generated preview of the message is retrieved. It may not correspond to the message actually sent, in case modifications were made after the last preview generation.
Previews can be retrieved for a maximum of 90 days after being generated. Alternatively, a new preview can be generated using the Force a new preview button.

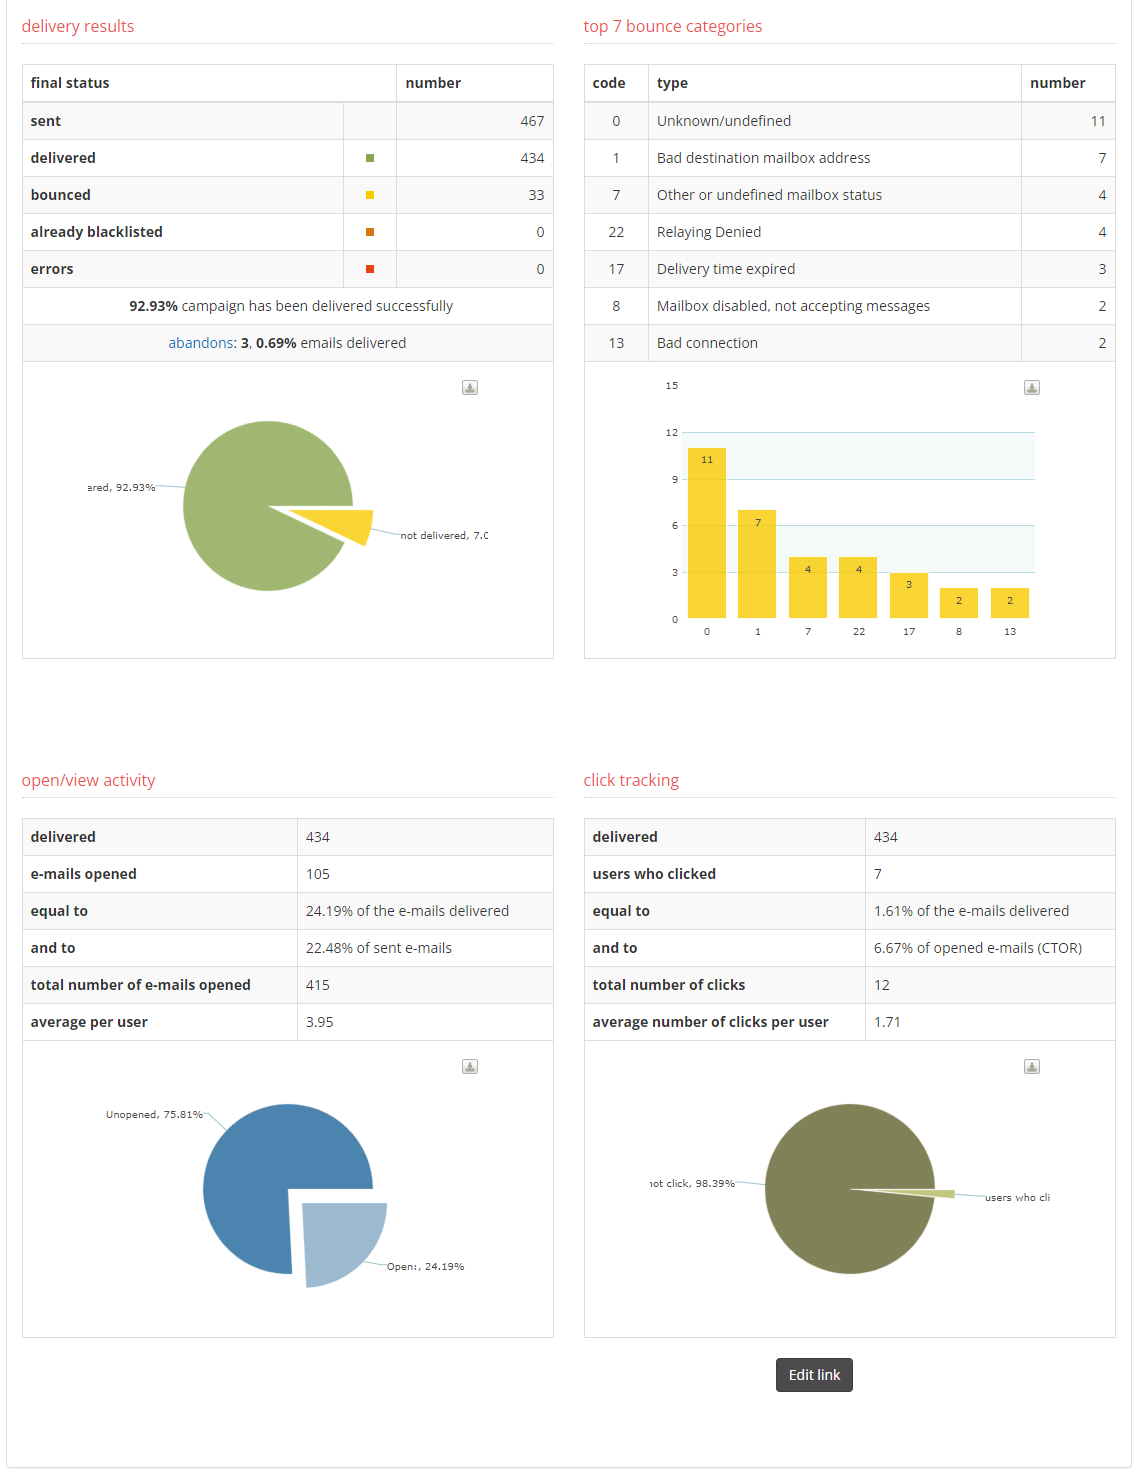
The chart on delivery results shows how many messages were actually sent, delivered, bounced, already blacklisted and any errors. The adjacent chart displays the main reasons emails were bounced (full mailbox, non-existent mailbox, unable to contact the server, etc.).
In the last two pie charts, you can see the open/view activity and the click tracking. The value Users who clicked refers to the unique clicks of users (if I click on 3 different links, I will be counted only once).
Categorization by sector is very important, especially if messages are sent regarding very different sectors. It will then be possible to obtain statistics on the distribution by category of the campaigns made. Each campaign can be associated with one of the preset commercial sectors:
On the home page of the campaign archive, a pie chart will display the distribution of campaigns by sector. Additionally, next to each campaign, a different colored dot will appear depending on the primary assigned sector.
Sent
This tab collects data on Sent. In the submenus "Sent," "Delivered," "Bounced," "Errors," "Blacklist," the relevant graphs and detailed statistical data are contained.
Sent
Here, the data related to the sent emails is described. A chart shows the emails sent per domain (e.g., 3000 emails on gmail.com, 2500 on yahoo.it, etc.); a "user table" lists the individual users, email address, and domain to which the emails were sent.
Delivered
Here, the data related to the delivered emails is described. A chart shows the emails delivered per domain and a "user table" lists the individual users, email address, and domain to which the emails were delivered.
Bounced
This tab contains statistics related to undelivered emails. The most significant tab is probably the first, which lists and shows in a chart the reasons for non-delivery. The "Split Domains" shows the number of messages bounced from each domain. In the user table, there is a list of users to whom the email was not delivered.
Legend of numerical codes identifying bounces:
| Code | Type | Definitive/Temporary | Explanation |
|---|---|---|---|
| 0 | Unknown/undefined | NO | Bounce type not defined. |
| 1 | Bad destination mailbox address | Definitive | The specified email address does not exist. This means that the part to the left of the @ is invalid. |
| 2 | Bad destination system address | Temporary | The domain specified in the email address is unable to accept emails. |
| 3 | Bad destination mailbox address syntax | Temporary | A syntactic problem was detected by the receiving domain. |
| 4 | Recipient Block Policy | Temporary | The receiving user has created (only at the level of their mailbox) a personal filter that blocks the sender's email address or domain. |
| 5 | Bad sender’s mailbox address syntax | NO | The sender's address was not syntactically valid. |
| 6 | Bad sender’s system address | NO | The sender's domain is unable to accept reply emails. |
| 7 | Other or undefined mailbox status | NO | The mailbox was unable to accept emails. |
| 8 | Mailbox disabled, not accepting messages | Temporary | The mailbox exists but does not accept messages. It may be a temporary or definitive error. |
| 9 | Mailbox full | Temporary | The user's mailbox is full because it has reached its maximum capacity. It can be freed by deleting messages. |
| 10 | Message length exceeds administrative limit | Temporary | An administrative limit on message size has been exceeded. This error occurs when the allowed size by the recipient's mailbox is less than the generic system limit. |
| 11 | Reputation block | NO | Message rejected due to reputation issues of the sender's IP address or domain, caused by being listed on public blacklists or blocks by anti-spam systems, on email providers that return this type of bounce. This type of issue is resolved as soon as the IP or domain is unblocked or delisted; for this reason, this type of bounce does not cause the sender's email address to be blacklisted. |
| 12 | No answer from host | NO | The outgoing connection attempt was not accepted either because the system was busy or incapable. |
| 13 | Bad connection | NO | The outgoing connection was established but was unable to process the message, either due to a timeout or poor connection quality. |
| 14 | Routing server failure | NO | The system was unable to forward the message due to unavailable directory servers (e.g., inability to connect to the DNS server). |
| 15 | Unable to route | Temporary | The system cannot determine the correct route to reach the destination server. Sometimes this may also depend on the non-existence of the domain. |
| 16 | Routing loop detected | NO | Mail servers check if the same message passes through them multiple times, and after a certain number of times (at the discretion of the postmaster as always), they decide that the message will never reach its destination and return it, communicating the rejection. |
| 17 | Delivery time expired | NO | Our system, in the case of the recipient mail server being unreachable (without receiving a specific rejection), performs multiple retries. If after 48 hours it still fails to deliver the message, it is considered failed and categorized as a bounce. (The cause may be a temporarily down server or a domain without MX records) |
| 18 | Other or undefined protocol status | NO | An error occurred in the message transmission protocol. |
| 19 | Invalid command | NO | A protocol command was entered out of sequence or unsupported. |
| 20 | Syntax error | NO | A protocol command was entered that cannot be interpreted due to incorrect syntax or was not recognized. |
| 21 | Delivery not authorized, message refused | NO | The sender is not authorized to send to the specified recipient. The cause may be a block by an anti-spam filter per-host or per-recipient. |
| 22 | Relaying Denied | NO | In a pass through various servers, one of them was unable to deliver the email. The message is rejected by the server, which may depend on the sender being recognized as invalid or unacceptable. |
| 23 | Service not available – access denied | NO | Typically caused by incorrect or old email addresses; when attempting to deliver emails to a server that is only intended to send mail and not to receive it. Sometimes used as a response when emails are rejected as spam. |
| 24 | Message considered to be spam | NO | The message is considered spam. |
Blacklist
Here, the messages that were not sent because they were added to the ContactLab blacklist are reported. More information on the blacklist can be found in the chapter “Analyse -> Blacklist” of this manual. Specifically, it shows:
- Addresses added to the blacklist due to the current sending: with a division between temporary and definitive blacklists.
- Addresses already present in the blacklist before the sending: both in terms of top domains and blacklist composition (temporary and definitive).
Errors
This tab reports any errors in the campaign, i.e., email addresses with incorrect syntax.
Unsubscribes/abandonment
The various reasons for a user’s "abandonment" will be summarized: unsubscribe, list unsubscribe, feedback loop, abuse.
Opens
In the "Opens" tab, statistical data related to openings is available.
How does the platform understand when an email has actually been opened?
Within each message sent from the platform, a small code is automatically inserted that calls for a "tracking image": this is a tiny 1 pixel x 1 pixel image, invisible to the end user, which is loaded along with all the other images present when the message is opened. The URL from which the system retrieves this tracking image is over the secure HTTPS protocol. When the tracking image is loaded, the server where it resides logs it, allowing the platform to know that the email has been opened.
However, if for any reason the tracking image is not loaded, the platform will never know that the message has been opened. It may happen that some client programs (Outlook, Thunderbird, or others) or some webmails block the images present in HTML emails. If the image blocking is not removed, the opening will not be recorded by the platform. However, let’s consider the case where image blocking is enabled (so the images have not been loaded), but the user clicks on a link within the message. At this point, even if the tracking image has not been loaded due to blocking, the platform records the click on the link: if the user has clicked on a link, it means they have opened the email. This opening will then be recorded anyway, under the appropriate "hidden openings" tab.
Below is an explanation of the individual tabs that make up this section.
Summary
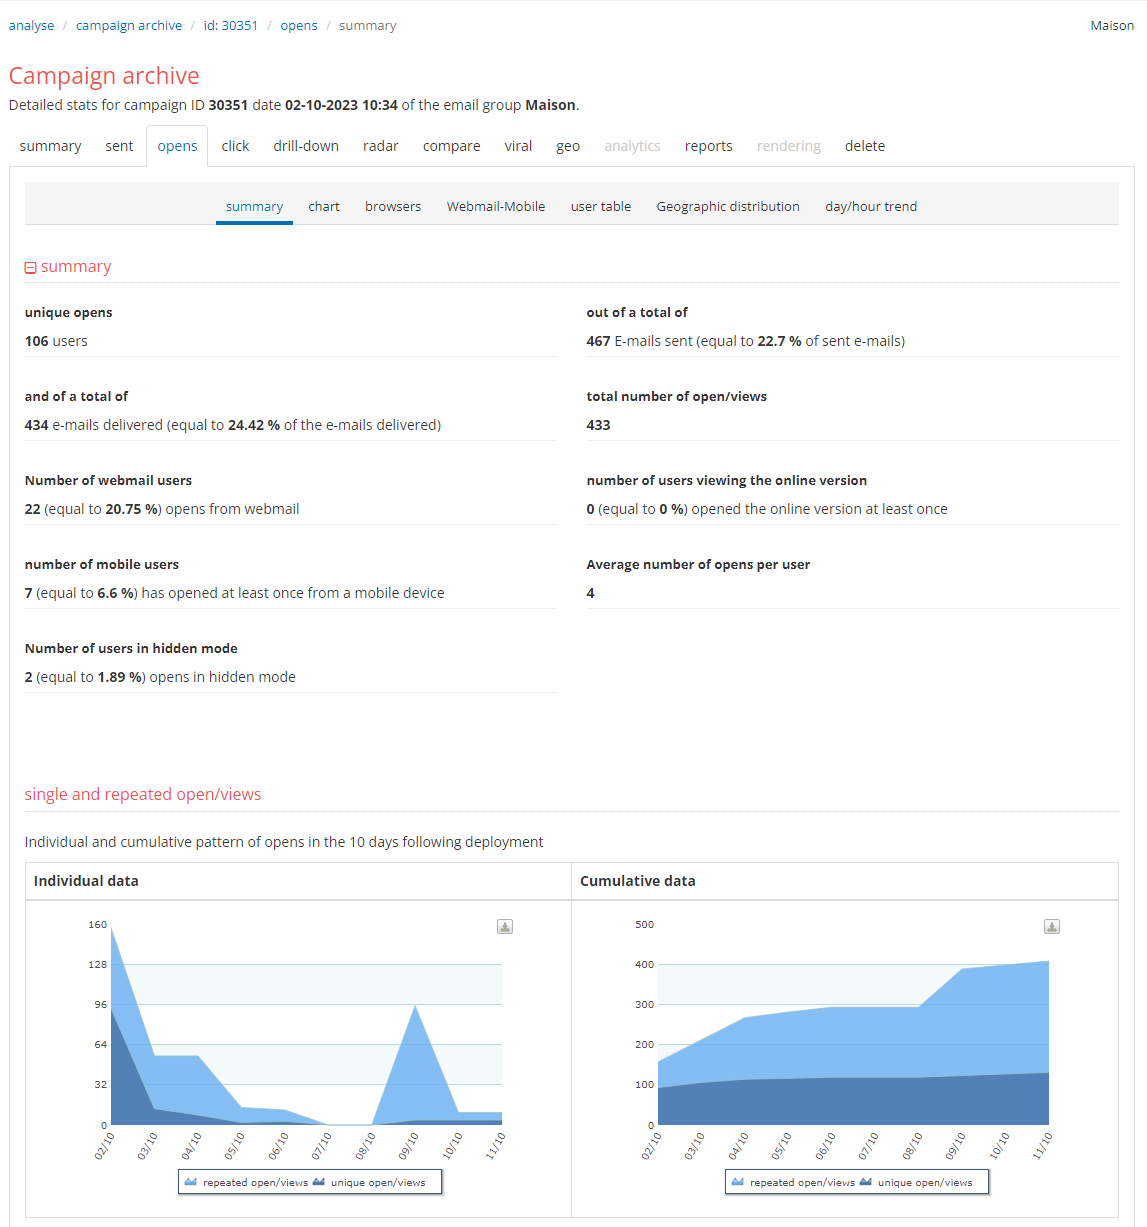
In the "summary" tab, the graphical trend of unique and repeated openings over the 10 days following the sending is shown, both the point data and the cumulative data:
Chart
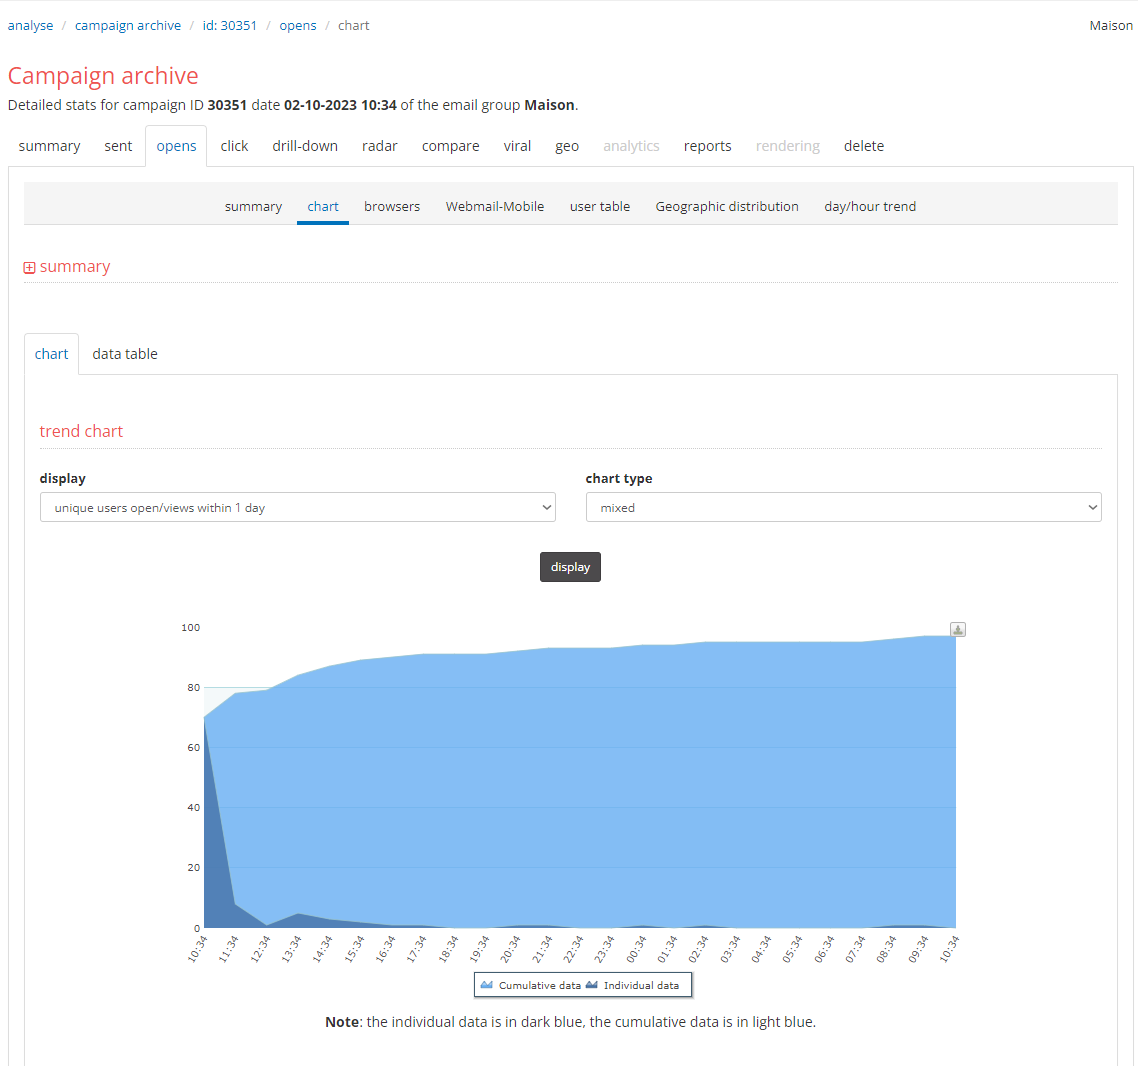
In the "chart" tab, the graphical trend of openings within a certain time range (from 1 hour to 30 days) is shown:
Browsers
In the "browsers" tab, you can see how openings are distributed across various browsers.
Webmail-mobile
In the "webmail-mobile" tab, you can see the opening percentages by type of receiving device: email client, webmail, or mobile device, along with a graph related to openings from webmail, showing the breakdown by domain.
The data presented here in the interface refers to unique openings, while downloading the corresponding report in the "Report" tab includes all openings (also those made multiple times by the same person over time).
Regarding mobile devices, the graphs show the model and the family (brand) of the device.
User table
In the "user table" tab, the users who have opened the campaign are shown, with reference to the device used and the date/time of the action.
Geographic distribution
In the "Geographic Distribution" tab, the main countries from which the campaigns have been opened are shown. The IP address is used as a reference, so there may be false positives.
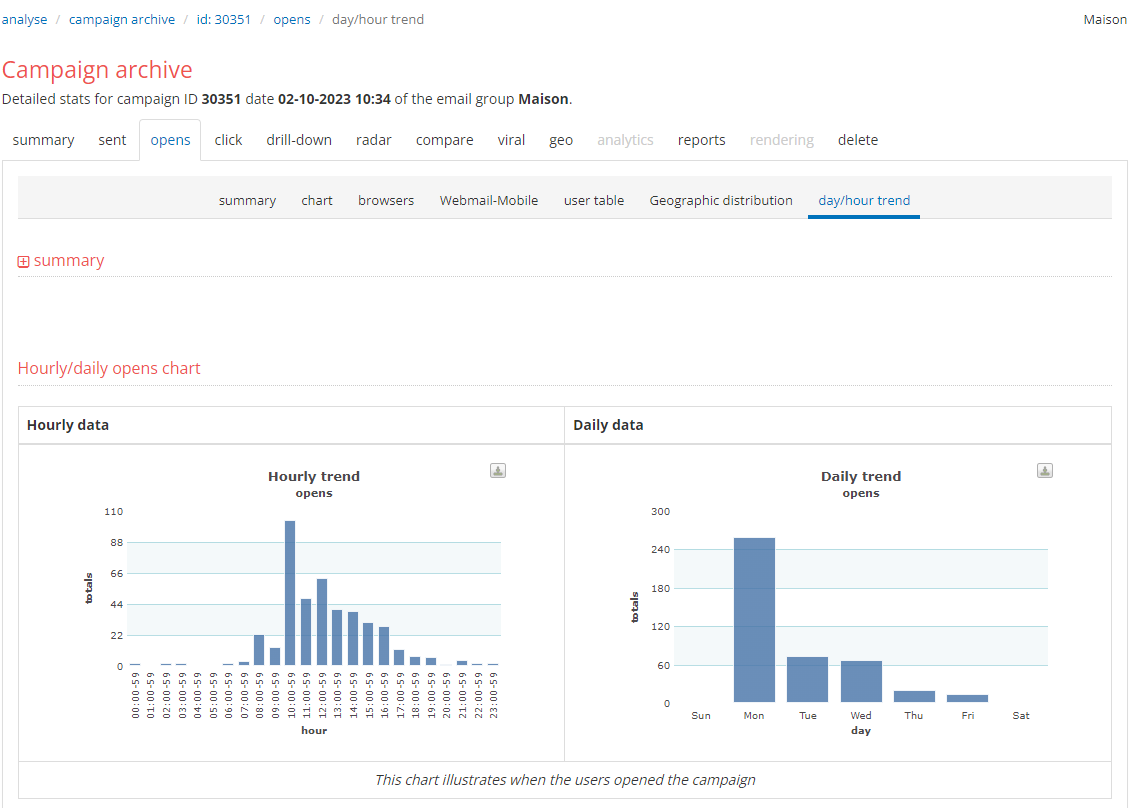
Day/Hour trend
In the "day/hour trend" tab, the days of the week and the times when the sending recorded the most openings are shown.
Click
This tab pertains to the links present within the message. The number of links present, the number of users who clicked on them, the geographic distribution of clicks, and the category of clicks.
Links are tracked through the rewriting of the original URLs into a tracking URL. By default, the base path of the tracking URLs is: https://t.contactlab.it/...
Below is an explanation of the individual tabs that make up this section.
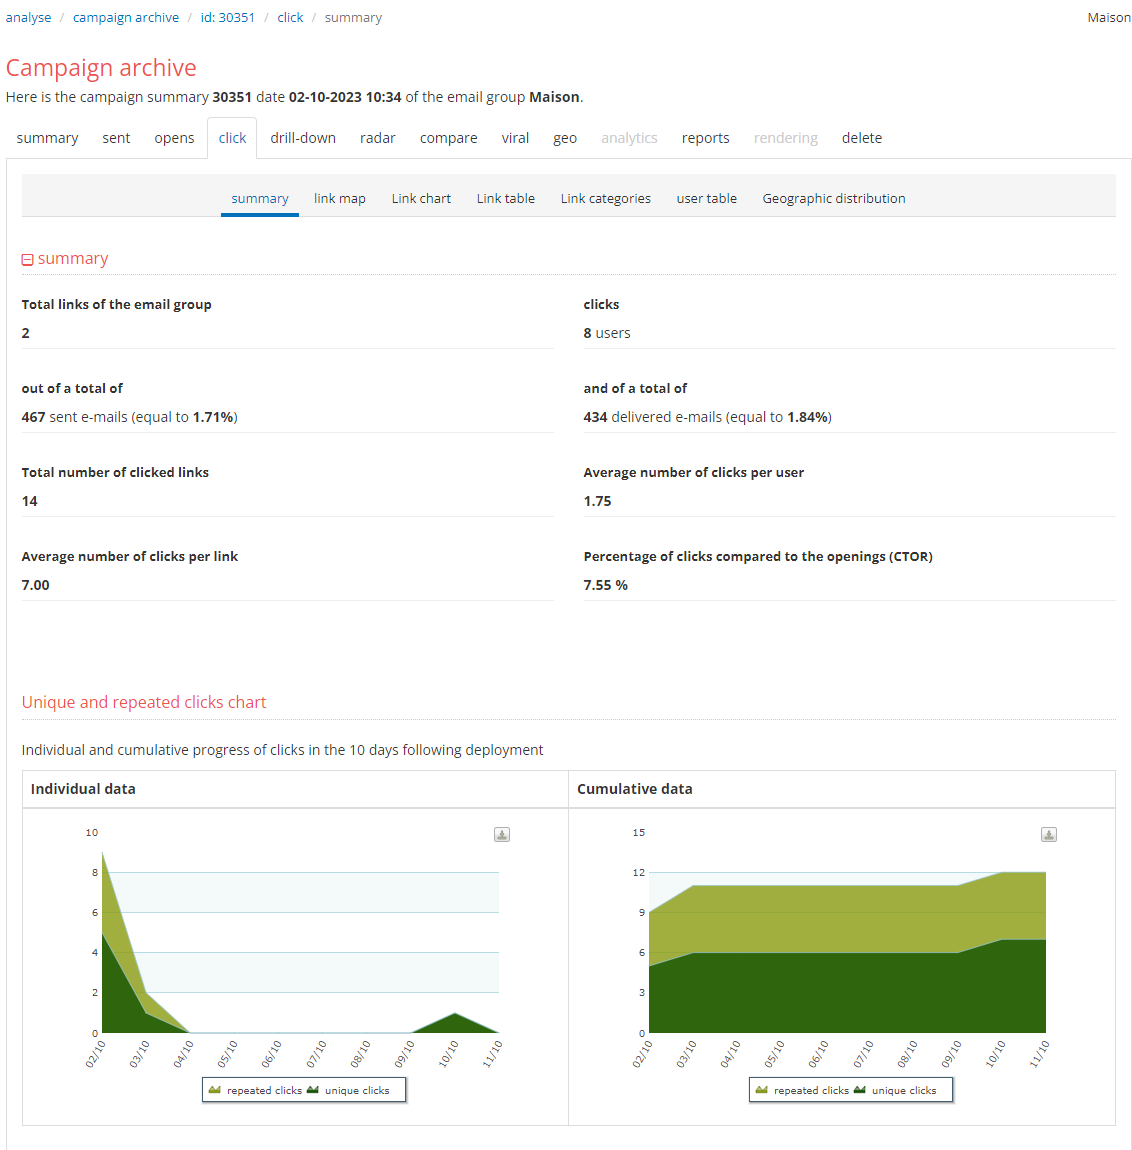
Summary
In the "summary" tab, the trend of clicks in the 10 days following the sending is shown; both the point data and the cumulative data are available.
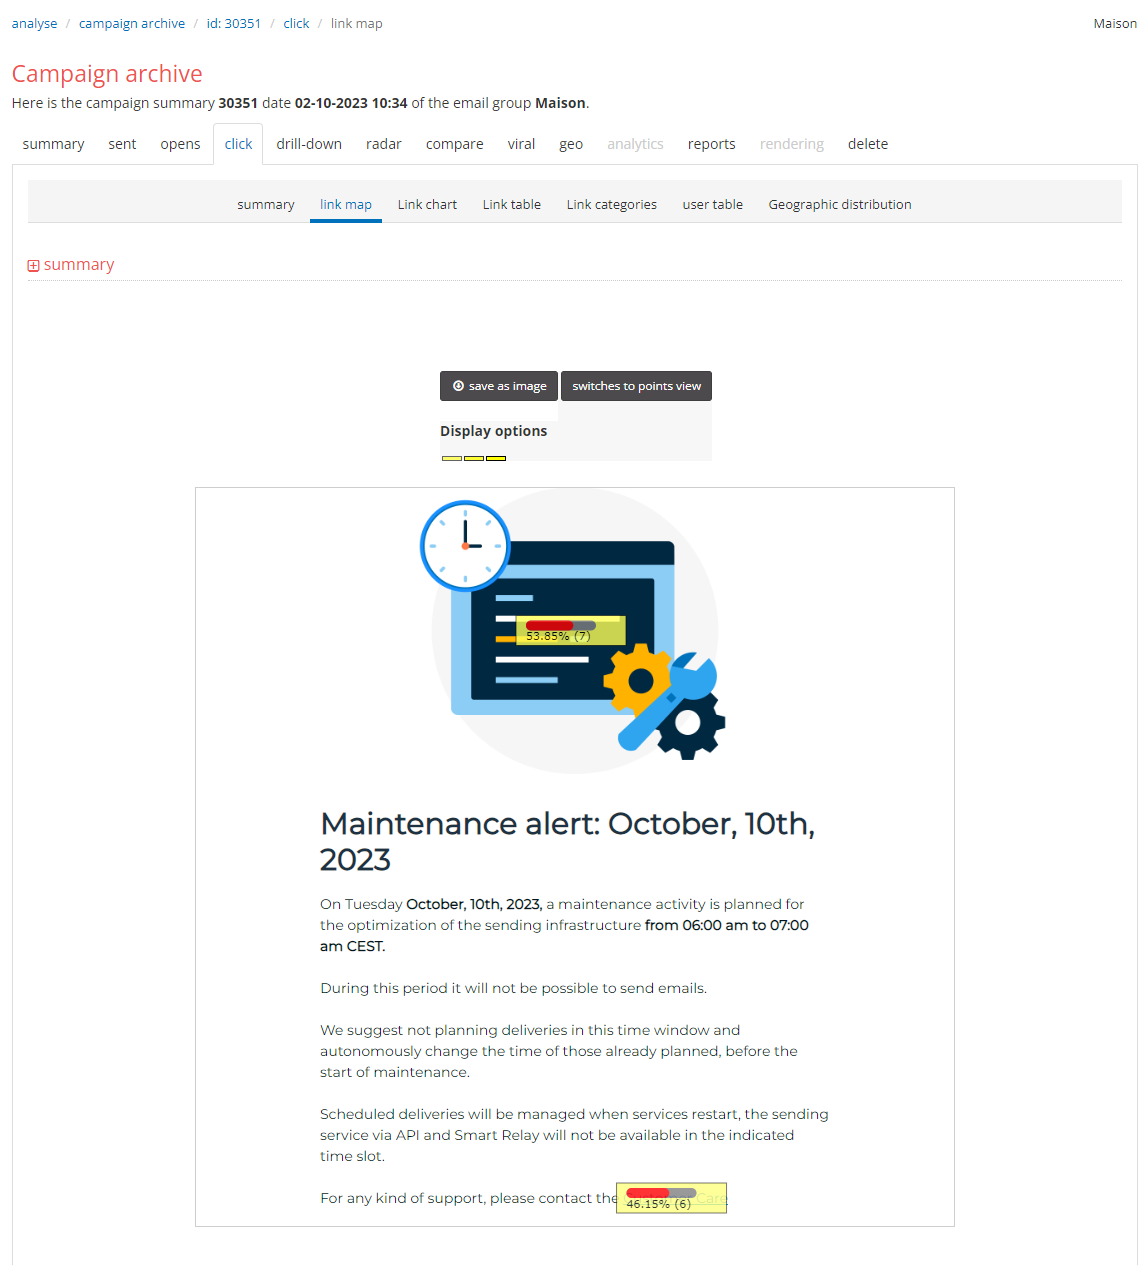
Link map
Clicking on "link map" displays a graphical preview of the message, on which labels indicating the number of clicks and the corresponding percentage (how much a link was clicked compared to the others) have been inserted at each link's position. This way, you can visually check which areas of the text are clicked the most and adjust the content layout accordingly. The simulation data relates to unique clicks on the link (if I click on 3 different links, I will be counted once for each link). It is also possible to save the link map as an image and/or switch to a point view:
Link chart
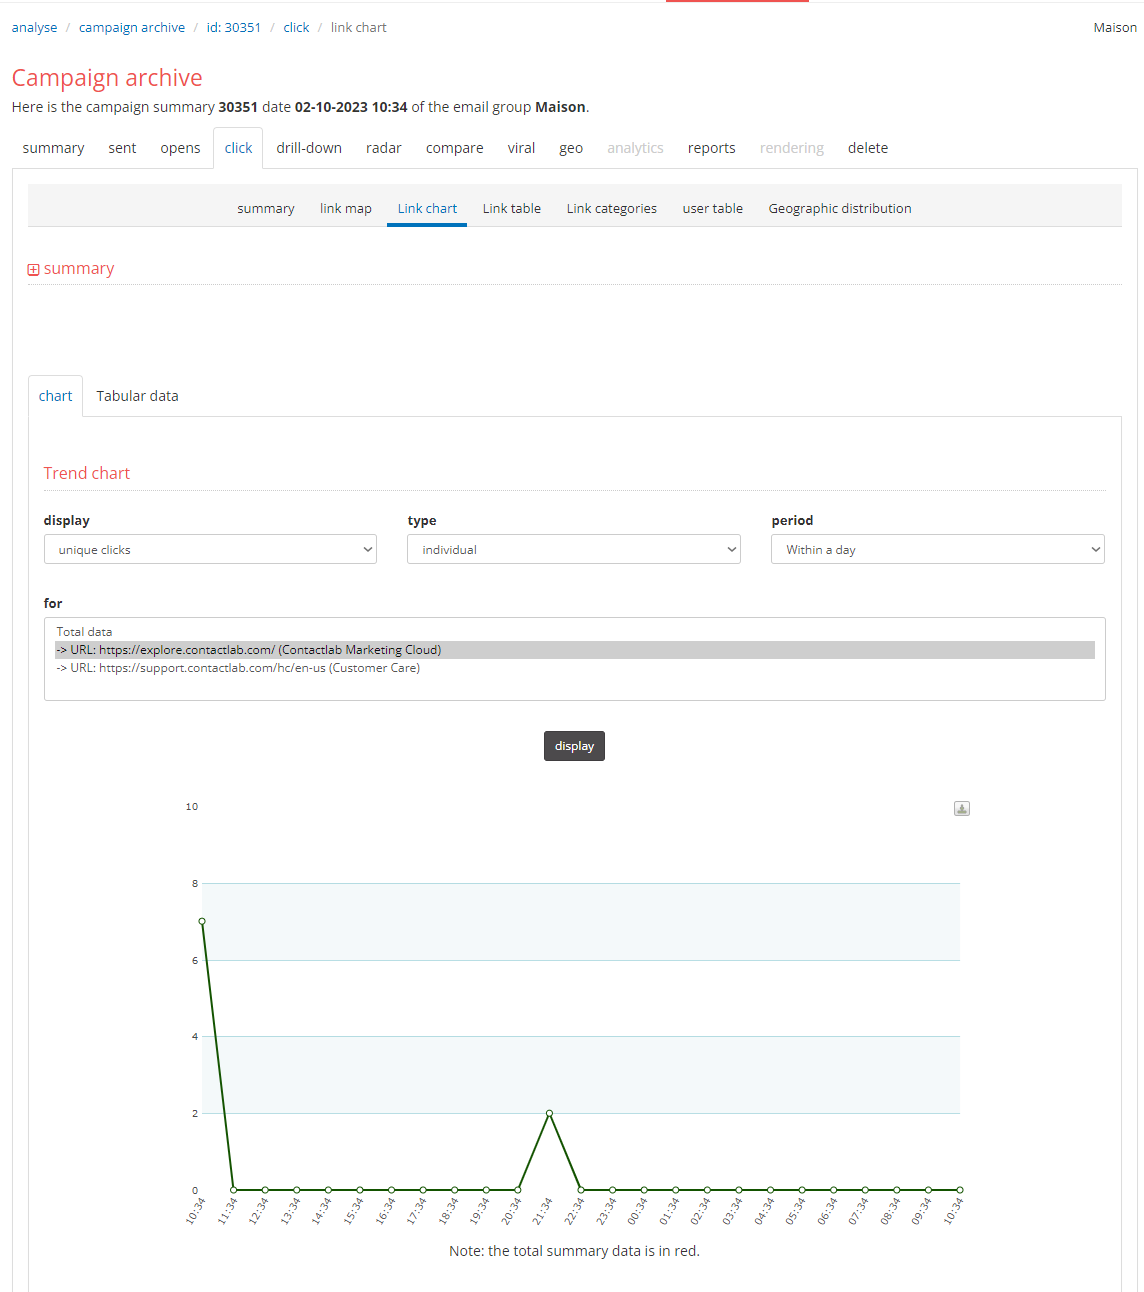
After the "Link Map" tab, we have the "Link Graph". The graph is dynamic: it can be modified to show only the data of interest by acting on the dropdown menus above the graph and then clicking on the "show" button.
Let’s see how to read and use the results of the graph.
It shows:
- Unique clicks: each user who clicks at least one link is considered only once (even if they click 10 links, they will be counted as 1).
- Repeated clicks: all individual clicks are counted (even when a user clicks the same link multiple times).
Type:
- Point: this is the data related to the specific time chosen (for example, a single day).
- Cumulative: this is the cumulative data from the time of sending until today, thus taking into account the clicks made in that period.
Period:
Allows you to choose the period you want to monitor (12 hours, 1 day, 1 week, etc.).
For:
- Total summary data: considers all links present in the sending.
- Single link: allows you to choose among the various links present, each identified by a numerical ID.
In addition to the graph, by clicking on "source data" you can view the numerical data of the clicks, sorted in a table.
Link table
The "Link table" tab displays the links present in the message:
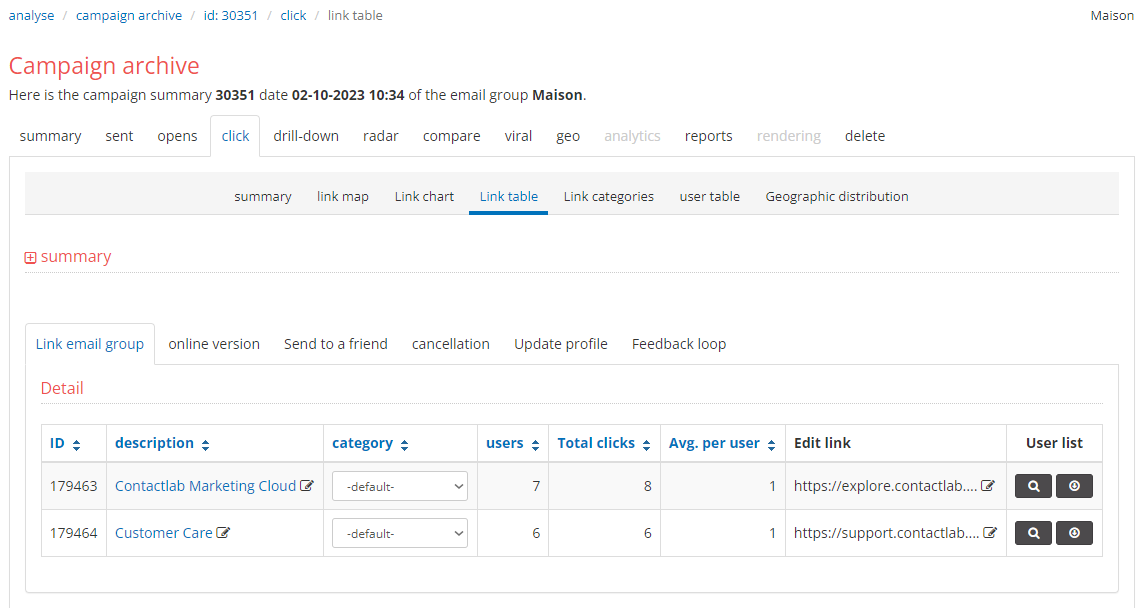
Next to the ID and description of the link, we find the category it is associated with (see "Configure–>Categories"); by clicking on the appropriate dropdown menu, it is possible to change the associated category. To modify or create new categories, you need to go to the section "Configure > Categories". By associating new categories, the previously recorded clicks will not be lost: they will simply be divided into new categories.
To the right of the categories, the user data and the number of clicks. The "Users" data refers to unique clicks on the link (if I click on 3 different links, I will be counted once for each link). In "Edit link", it is possible to modify the destination URLs of the tracked links present in an email.
In the various subsections, it will be possible to analyze the data of: Viewing the online version, referring to a friend, unsubscribing, updating the profile, and feedback loop.
Link categories
In the "Link categories", there are statistics related to the link categories to see which category has the highest percentage of clicks. The statistics for each category are divided into 3 pie charts:
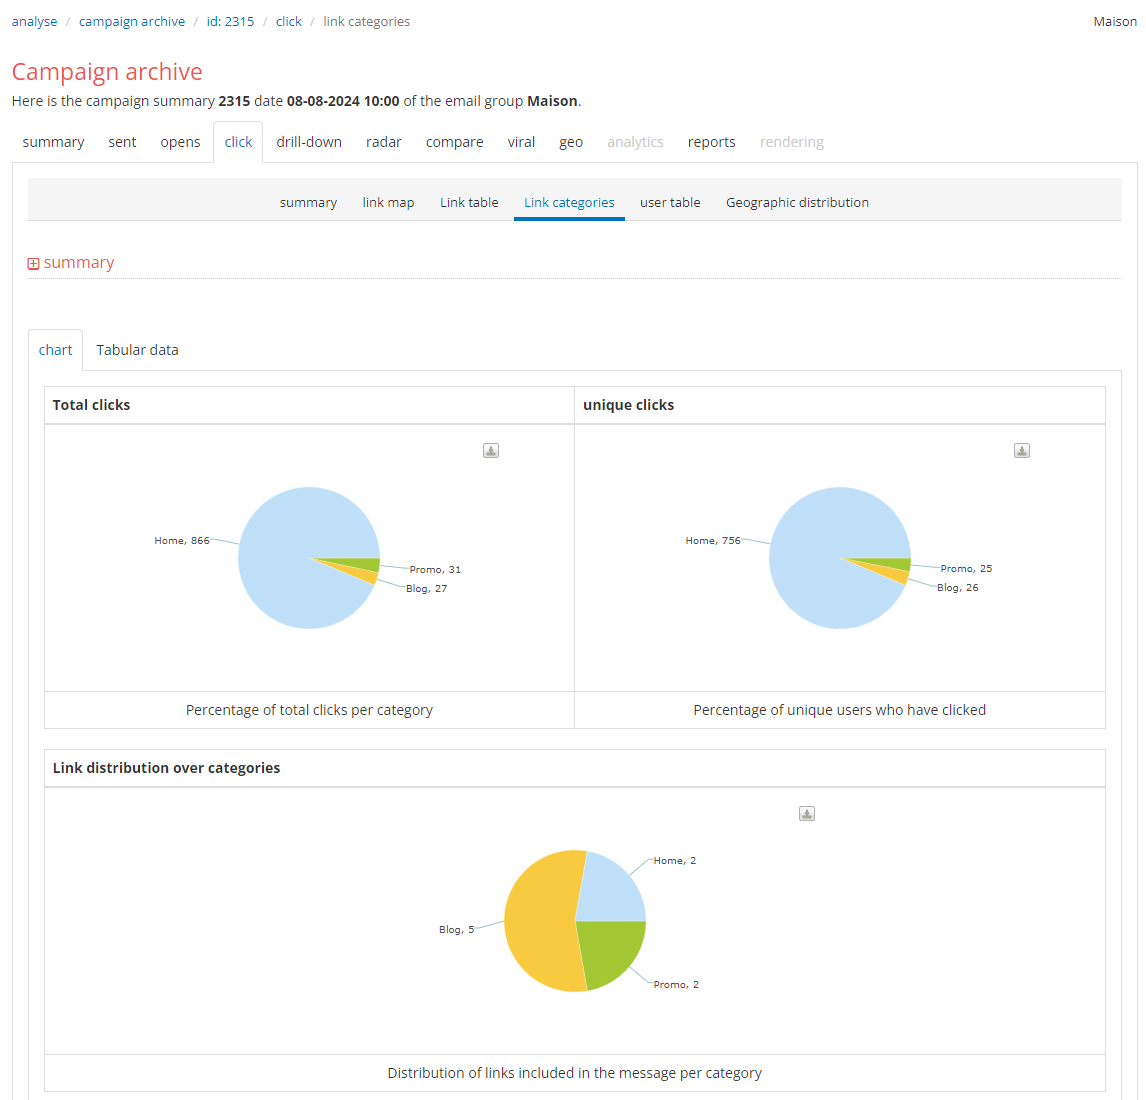
The first chart in the upper left, "Total Clicks" indicates the percentage of total clicks (including repeated clicks) for each category. The second, "Unique Clicks" indicates the percentage of unique clicks (not counting clicks after the first) for each category. The last chart, "Link Distribution by Categories" indicates the distribution of links across the various categories (how many links, in percentage, there are in the different categories).
User table
The "User Table" lists the users who clicked, specifying how long it took them to do so.
In the "Undelivered", "Openings", and "Links" tabs, clicking on "User Table" will show a button "Download user list - extended extraction." That button allows you to download the list of users who performed the action (that is, who did not receive the email if you are in the "Undelivered" tab, who opened the email, or who clicked on the links) in "extended" mode.
The extended extraction will contain, in addition to the users' emails, also the other visible fields (see "Configure–>User DB"). Visible fields refer to the fields made visible by the database control panel, in the Configuration > Field Management tab. When requesting an extended extraction, the system will associate with each user the fields that are currently "visible fields" in the database.
The extended extraction is valid only if the database associated with the group is still the same as when the sending was made. If the sending was made using a database, and then a different database was subsequently associated with the group, it is useless to make the extended extraction. This is because the list of users recorded in the statistics would no longer correspond to the users present in the database, and consequently, the visible fields would be associated with the wrong user.
Geographic distribution
In the "Geographic distribution" tab, clicks are divided by country. This data is unique for IP, so if the IP is the same and the users are different, only one action is tracked. Hovering over a country on the world map will show a message with the number of clicks recorded and the corresponding percentage of the total. Below, a table lists the countries with their respective data.
Drill down
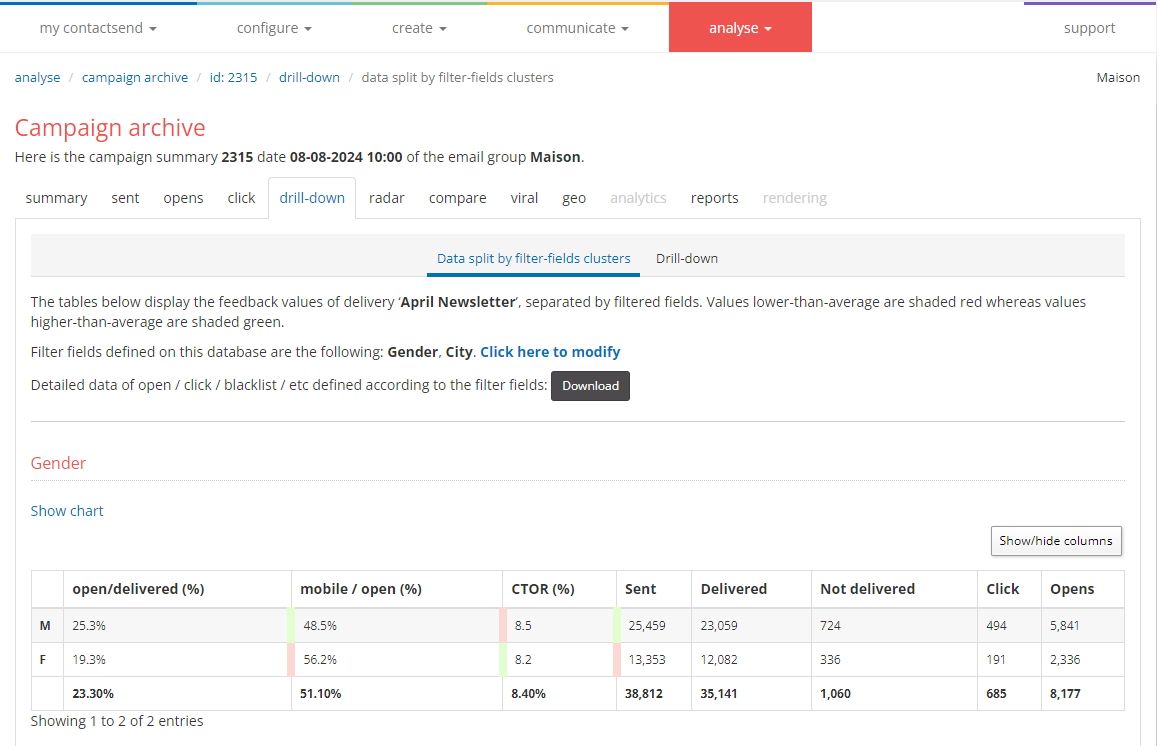
By enabling the filter fields in the Database configuration (see “Configure–>User DB”), it is now possible to generate graphs to understand the profile of the most responsive user. The information is provided for all main events and is also available at the percentage level. Both a tabular and graphical view are available:
Radar
By entering an email address belonging to a user who received the message, the statistics related to that user will be displayed: whether the campaign was successfully delivered, if they opened it, how many times, from which IP addresses/Countries, and which links they clicked within the message.
Compare
Here you can compare the current campaign with another one, selected from the list of all deliveries sent:
The two graphs compare the current campaign with the selected one, in terms of unique openings and unique clicks. The values shown in the graphs are also listed in tables, accessible via “Absolute Values,” “% of sent emails,” and “% of delivered emails.” It is also possible to compare the templates of the 2 campaigns and the sending lists.
Viral
This tab allows you to check for any unusual behaviors in the sent emails, such as openings from different IP addresses, the number of unusual openings, and the number of unusual clicks.
Geo
In this tab, the distribution by country of the sent emails is indicated, on a map of the world and in a table (similarly to the “Links > Geographic Distribution” tab, see above).
Reports
Here are collected all reports related to the various tabs: Summary, List of sent emails, List of successfully delivered emails, List of bounced emails, and so on, so that anyone wishing to download one or more reports can do so without entering the specific tab, simply by choosing it from the list. Additionally, upon request, more advanced reports can be made available: behavioral analysis and extended data reports.
Report Fields Legend
-
cl_status = status of the delivery, possible values:
- 1 Delivered
- ‐1 Bounce
- ‐2 Error
- ‐3 Definitive blacklist
- ‐4 Delivery interrupted
- ‐5 Temporary blacklist
-
cl_received = email received
-
cl_bounced = email classified as bounce (not delivered)
-
cl_blacklisted = email in blacklist
-
cl_cancelled = in case of interrupted delivery
-
cl_error = incorrect email (wrongly written email address)
-
cl_view = email opened
-
cl_view_mobile = email opened from mobile device
-
cl_click_u = unique clicks
-
cl_click_t = total clicks
-
delivery_date = delivery date
-
__cls1 = field for subscription. Subscribers have this field value=1, unsubscribers =‐1
-
__cl_last_view = indicates the last opening of the email
-
__cl_last_click = indicates the last click on the email
In general, in the columns, the value 0 indicates NO and the value 1 indicates YES.
Behavioral Analysis
This report allows you to obtain data regarding: deliveries, openings, clicks on links divided by user profile. The user profile is defined based on the “filter fields” set on the database (see “Configure–>User DB”).
The behavioral analysis is valid only if the database associated with the group is still the same as when the delivery was made, meaning if the users have not been overwritten and/or uploaded with another key.
Extended Data Download
This series of reports allows you to associate additional fields (the fields set as visible) with the list of desired emails.
That is, it will be possible to download the list of users who performed the action (i.e., who did not receive the email, who opened the email, or who clicked on the links) in "extended" mode. The extended extraction will contain, in addition to the users' emails, also the other visible fields: e.g., Name, Surname, Company_Name, etc.
Visible fields refer to the fields made visible by the database control panel in the “Configuration > Field Management” tab. When requesting an extended extraction, the system will associate with each user the fields that are currently “visible fields” in the database.
The behavioral analysis is valid only if the database associated with the group is still the same as when the delivery was made, meaning if the users have not been overwritten and/or uploaded with another key.
Delete
Here you can completely delete the archive of this campaign. Of course, once the campaign is deleted from the archive, it will no longer be possible to recover and check the related statistics.