Group analysis
In the Analyse > Group analysis section, you can analyze the campaigns contained in standard email groups, virtual groups, or compare the results of multiple campaigns in the free selection.
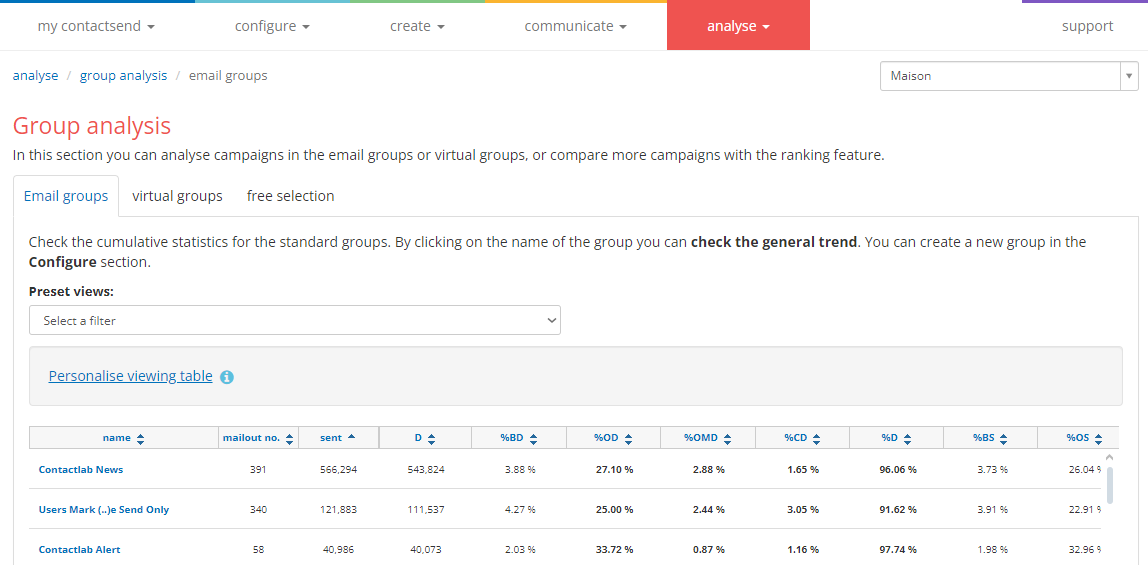
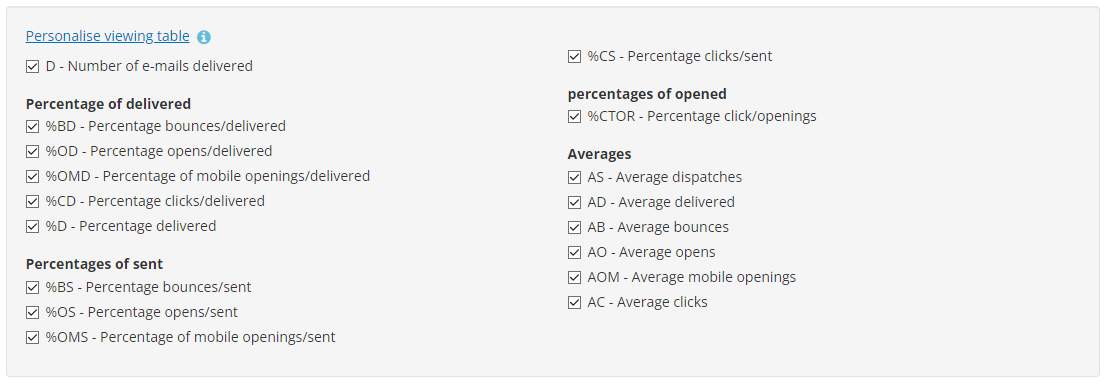
Click on Personalise viewing table to select the columns to display in the generated table or choose a predefined view from the dropdown menu.
Email Groups
In the email groups, you can analyze the statistics related to the campaigns of a single group. This allows you to check, compare, and analyze the performance over time of different campaigns and rank them accordingly.
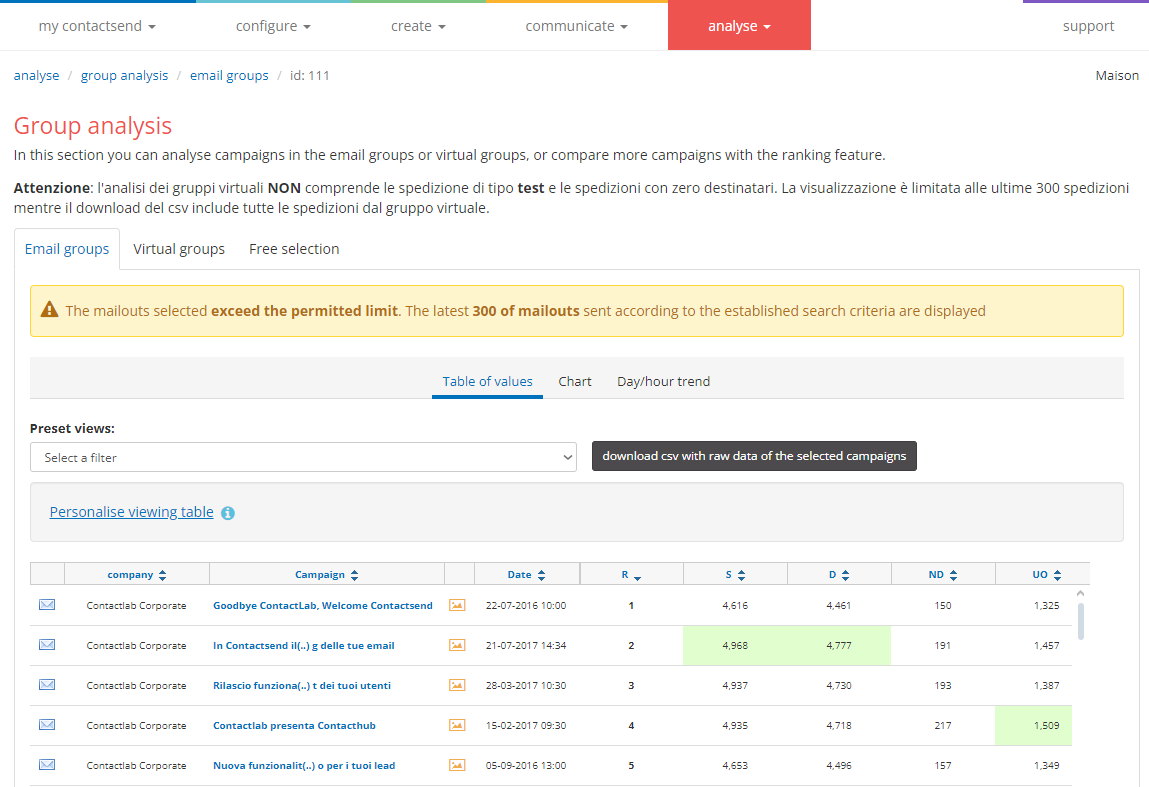
A ranking is also displayed based on several criteria: Number of emails sent, delivered, undelivered, opened, number of link clicks, and feedback loop.
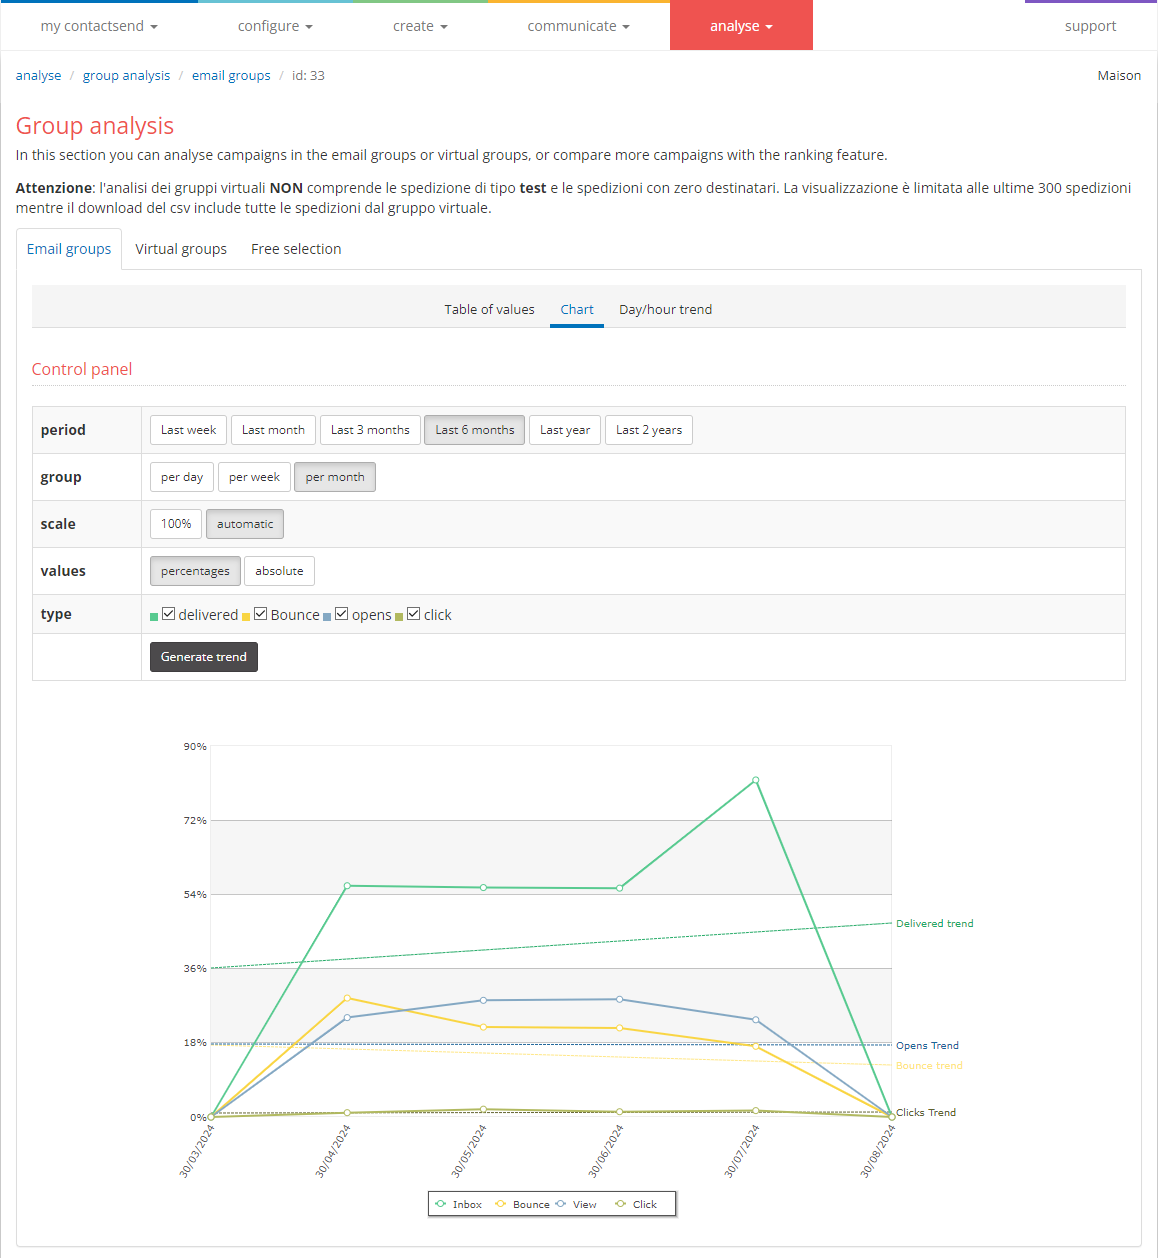
In addition to the Table of value, there are other tabs, such as Chart which offers graphs showing the trend of delivered/bounce/opens/click.
In the day/hour trend, there are two charts: the first related to the days and the second to the times when campaigns are sent.
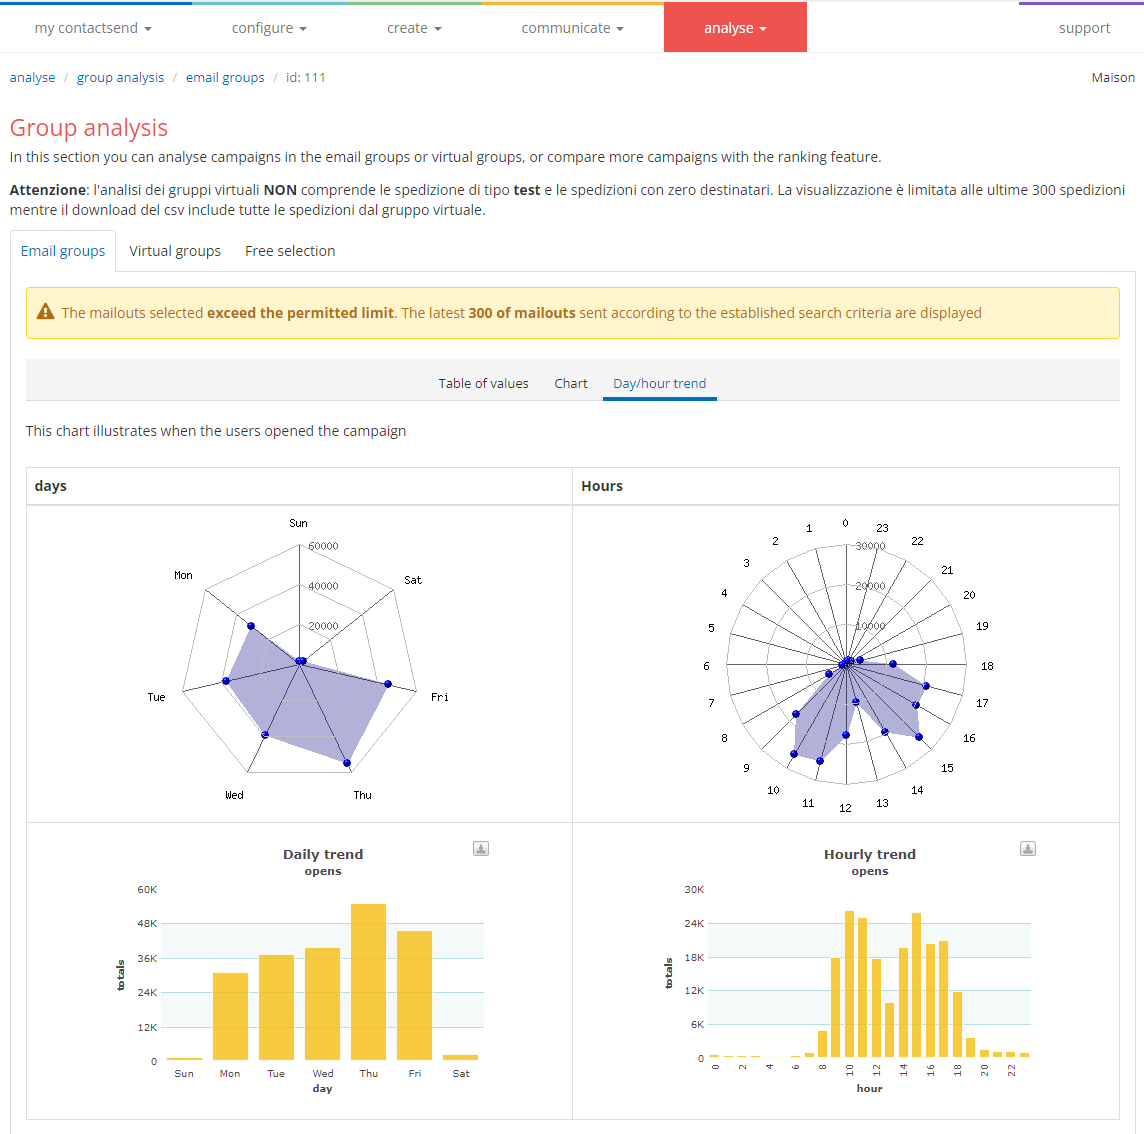
Let's look at the "Days" chart. The center of the chart represents zero, while the numbers indicating the emails sent increase as you move toward the edges. The 7 axes radiating from the center represent the days of the week. The further the dot is placed toward the edge, the higher the number of messages sent that day. In the example, the highest values are on Thursday.
Now, let's look at the "Hours" chart. As in the other chart, the center represents zero, and the values increase as you move outward.
The charts at the bottom present the same information in bar graph format.
Virtual Groups
In this section, you can analyze the performance in terms of opens and clicks for the virtual group created in “Configure → virtual groups”. The charts and information provided will be the same as those shown in the standard group analysis. The advantage is that you can analyze everything with various and combined criteria.
Free Selection
In this area, you can choose any campaign from the tree to compare them.
A ranking is also displayed based on several criteria: Number of emails sent, delivered, undelivered, opened, number of link clicks, and feedback loop.
It is also possible to analyze the trend over time of the selected campaigns for deliveries, bounces, opens, and clicks, just like for Groups and Virtual Groups.